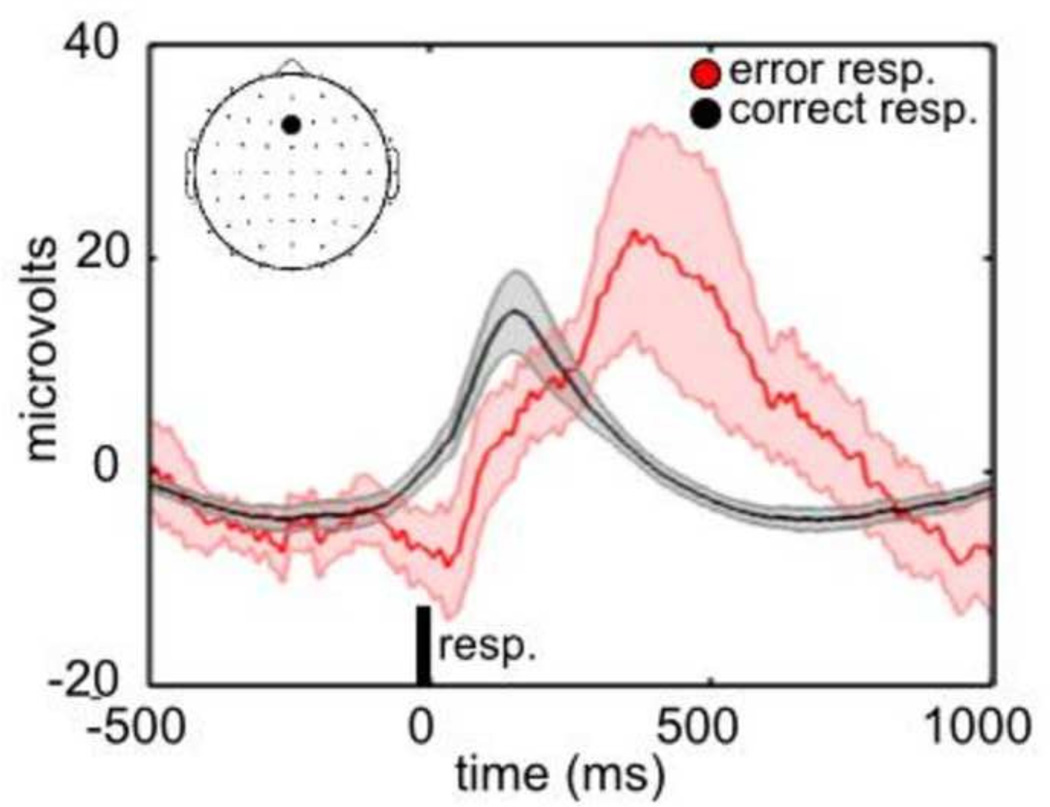
Figure 1.
ERP’s to correct and error responses. The average ERP (N = 51 subjects) is plotted separately following correct (in black) and incorrect (in red) behavioral responses. The ERP’s were averaged after epoching with respect to the onset of the behavioral response (0 ms). The responses are plotted for electrode Fz, as indicated in the upper left hand corner. The error bars represent the 95% confidence interval of the mean.

