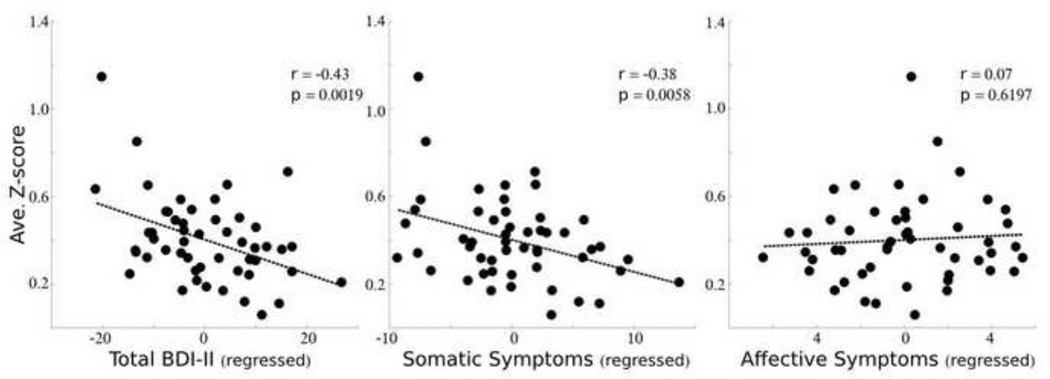
Figure 3.
Source amplitude and BDI symptoms. The average z-scored amplitude (around the peak full width half maximum (fwhm)) of source 2 is plotted against the individual total BDI score (left), the total somatic symptom score (middle) or the total cognitive-affective symptom score (right). The influence of age and IQ were regressed out of the total BDI-II score, and the cognitive-affective symptom score was additionally regressed out of the somatic symptom score (and vice versa).

