
Figure 2. Mechanism of VEGF-C binding to Nrp2.
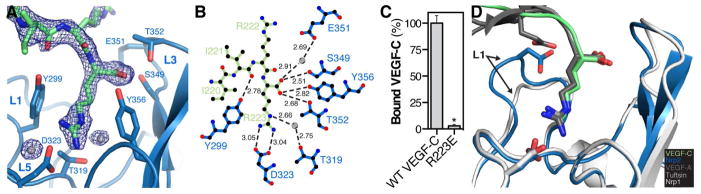
(A) Zoom of the intermolecular interface between Nrp2 (blue) and VEGF-C (green) with the 2Fo-Fc electron density map for VEGF-C contoured at 1.0σ. Interfacing water is shown as grey spheres. (B) Ligplot+ generated representation of the interaction between VEGF-C (green) and Nrp2 (blue). Bond distances (Å) are labeled in black and water is shown as grey spheres. (C) Nrp2 binding was compared between VEGF-C and VEGF-C R223E. Binding was measured in triplicate and is reported as mean ± SD (*p<0.05). (D) Superimposition of the VEGF-A HBD/Nrp1 complex (PDB=4DEQ) and the tuftsin/Nrp1 complex (PDB=2ORZ) onto the structure of the VEGF-C/Nrp2 complex demonstrates the shared and unique modes of engagement within this ligand/receptor family.