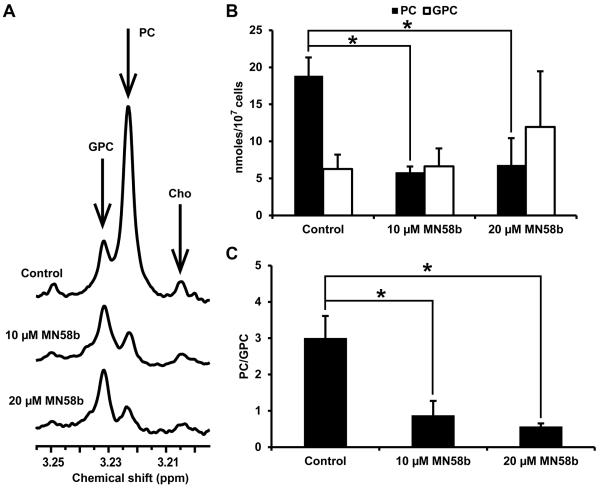
Figure 3.
In vitro NMR of F98 cell extracts (A). Untreated cells display high levels of PC (3.22 ppm) and low levels of GPC (3.23 ppm) (top spectrum); 10 μM MN58b reduces the PC resonance relative to GPC (middle spectrum) and 20 μM MN58b further reduces this ratio (bottom spectrum). (B) A bar graph showing the quantitation of PC and GPC from untreated, 10 and 20 μM MN58b-treated cells (C). The PC/GPC ratio demonstrates differences between untreated, 10 and 20 μM MN58b-treated cells. Asterisk (*) represents significant differences with a p-value of <0.05. Error bars represent ± SEM of 3 separate experiments.

