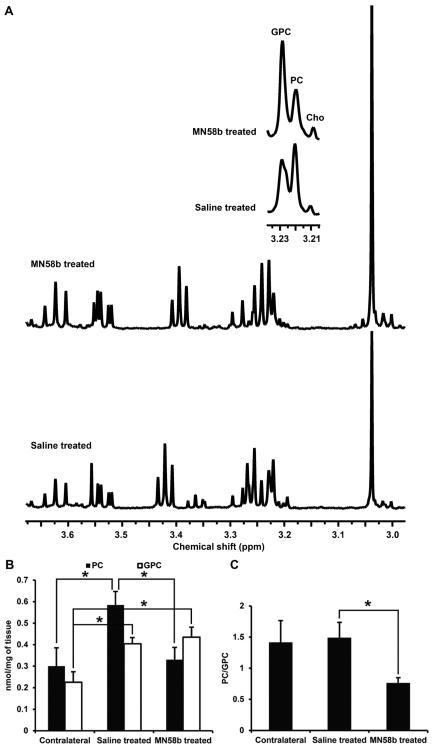
Figure 5.
(A) Representative in vitro 1H NMR spectrum from perchloric acid extracts of saline-treated (bottom) and MN58b-treated F98 tumors (top). The zoomed region (inset) is the spectral region from the choline-containing metabolites. Bar graph (B) demonstrates changes in PC and GPC levels from contralateral normal tissue, saline-treated tumors and MN58b-treated tumors. Bar graph (C) demonstrates the PC/GPC ratio in the 3 groups. Asterisk (*) represents significant differences with a p-value of <0.05. Error bars represent ± SEM.

