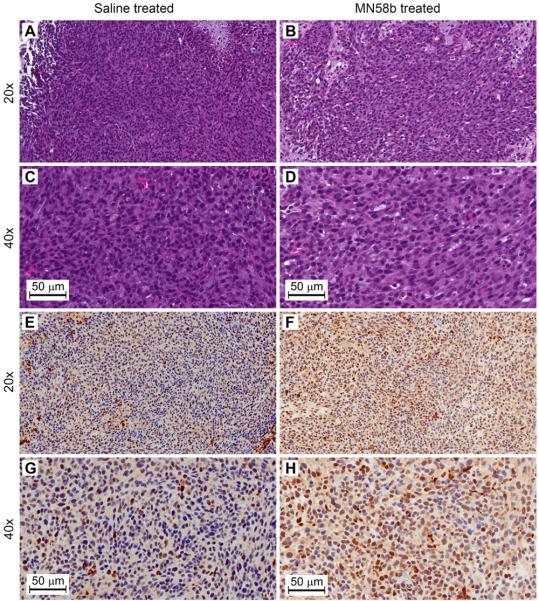
Figure 6.
Representative histological sections from saline-treated and MN58b-treated F98 rat brain tumors. H&E (A to D, 20 and 40x) and Caspase-3 (E to H, 20 and 40x) immunohistochemistry in tumor sections demonstrating decreased cell density in MN58b-treated tumors (B and D) compared to saline-treated tumors (A and C). Caspase-3 positive cells are increased in MN58b-treated tumors (F and H) compared to saline-treated tumors (E and G) indicating increased apoptosis. Scale bar is 50 μm.

