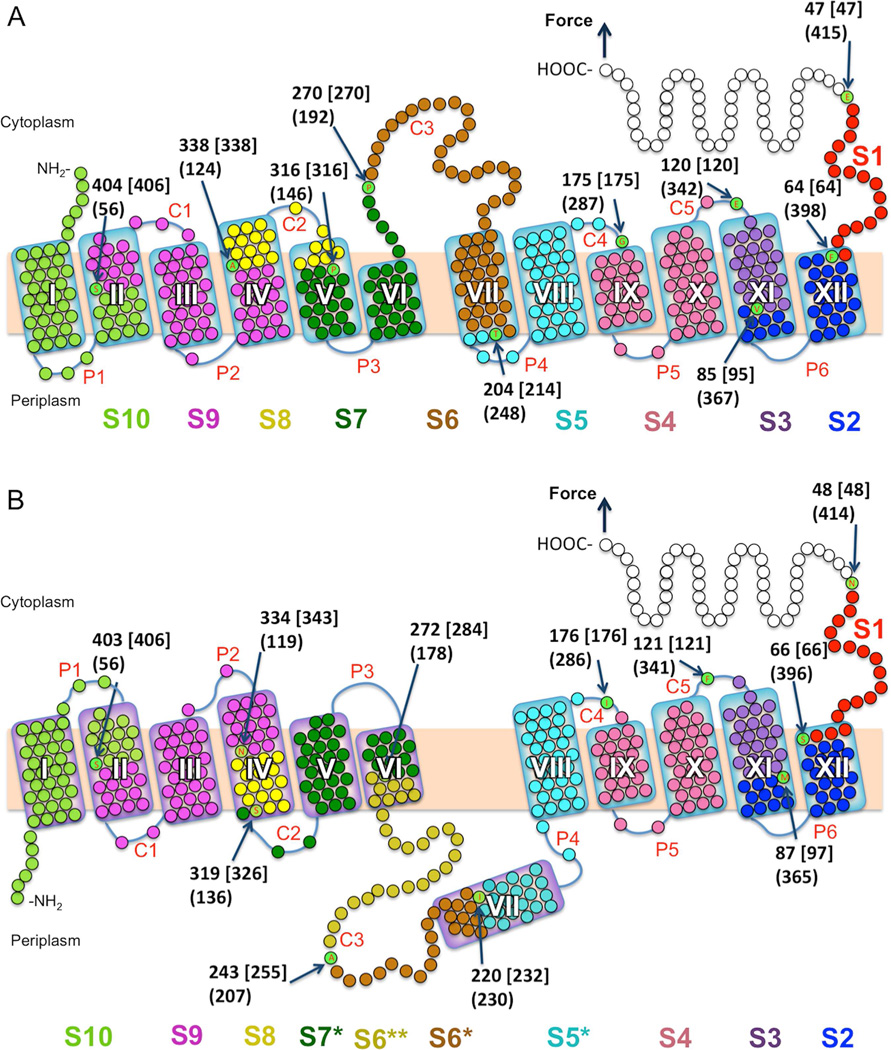
Figure 4. Effect of PE and PG on the stable structural segments in LacY.
(A and B) Structural segments were mapped to the secondary structures of WT LacY in native (A) and inverted (B) topologies. Stable structural segments mapped in (A) and (B) were detected in the class 1 and class 2 FD curves, respectively. (A) Secondary structure model of LacY (PDB ID code 1PV7) mapped with 10 (class 1 FD curves) structural segments S1–S10 (native topology) and (B) with 11 (class 2 FD curves) structural segments S1–S4, S5*, S6*, S6**, S7*, S8, S9, S10 (inverted topology). Each mean contour length of a force peak class (see histograms of Figure 2, 3) assigns the beginning of a structural segment (arrows pointing to aa). The numbers at arrows show the mean contour lengths of a force peak class (in aa), numbers in square brackets indicate the aa position counted from the C-terminal end, and numbers in parentheses give the aa position from the N-terminal end. Each of these numbers distinguishes the end of the previous and the beginning of a next stable structural segment. The length of polyGly tag and His-tag was considered for mapping. If the beginning/end of a stabilizing structural segment locates on the mica-facing side of the membrane or within the membrane the thickness of the membrane is taken into account. Transmembrane helices are labeled I-XII, cytoplasmic loops are labeled C1–C5 and periplasmic loops are labeled P1–P6.

