
Figure 1.
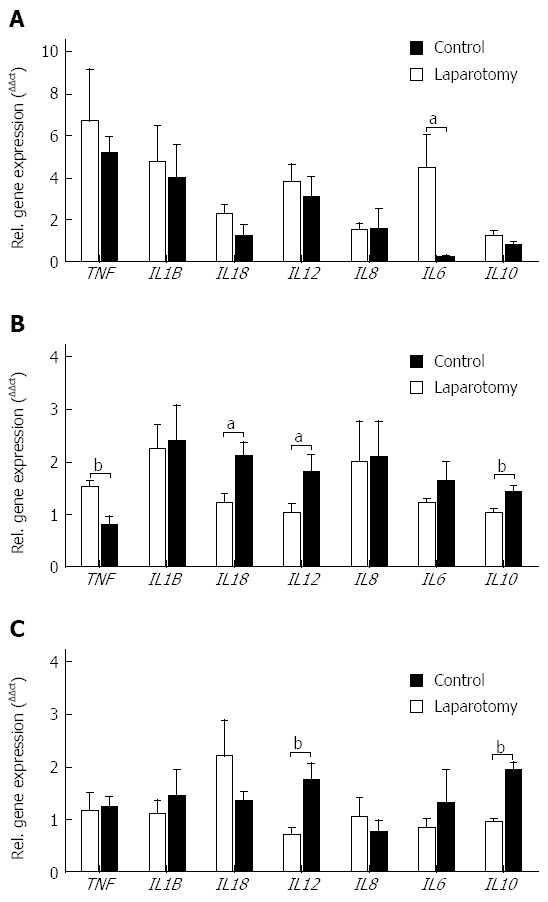
Relative gene expression of pro- and anti-inflammatory cytokines in (A) ileum, (B) terminal ileum and (C) colon from no-surgery control and transection surgery groups. Mean ± SEM. aP < 0.05, bP < 0.01 vs control.
Official websites use .gov
A
.gov website belongs to an official
government organization in the United States.
Secure .gov websites use HTTPS
A lock (
) or https:// means you've safely
connected to the .gov website. Share sensitive
information only on official, secure websites.
Relative gene expression of pro- and anti-inflammatory cytokines in (A) ileum, (B) terminal ileum and (C) colon from no-surgery control and transection surgery groups. Mean ± SEM. aP < 0.05, bP < 0.01 vs control.