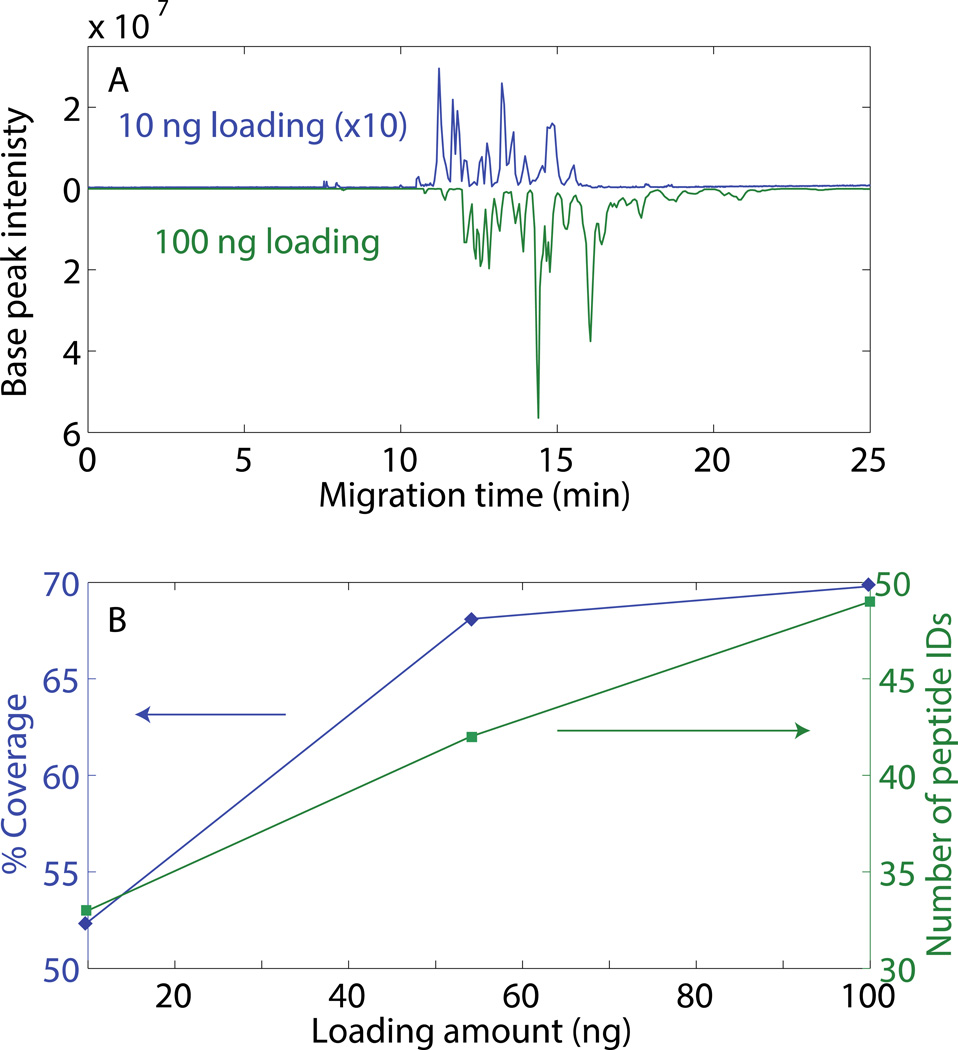
Fig 6.
Effect of sample loading amount on BSA peptide analysis. A. Butterfly plot of base peak electropherograms of a 0.1 mg/mL BSA tryptic digest using the SCX-SPE system. Blue – 10 ng loading amount; signal multiplied by 10×. Green – 100 ng loading amount. B. % coverage and number of peptide IDs as a function of loading amount. Other conditions are same as Figure 5.

