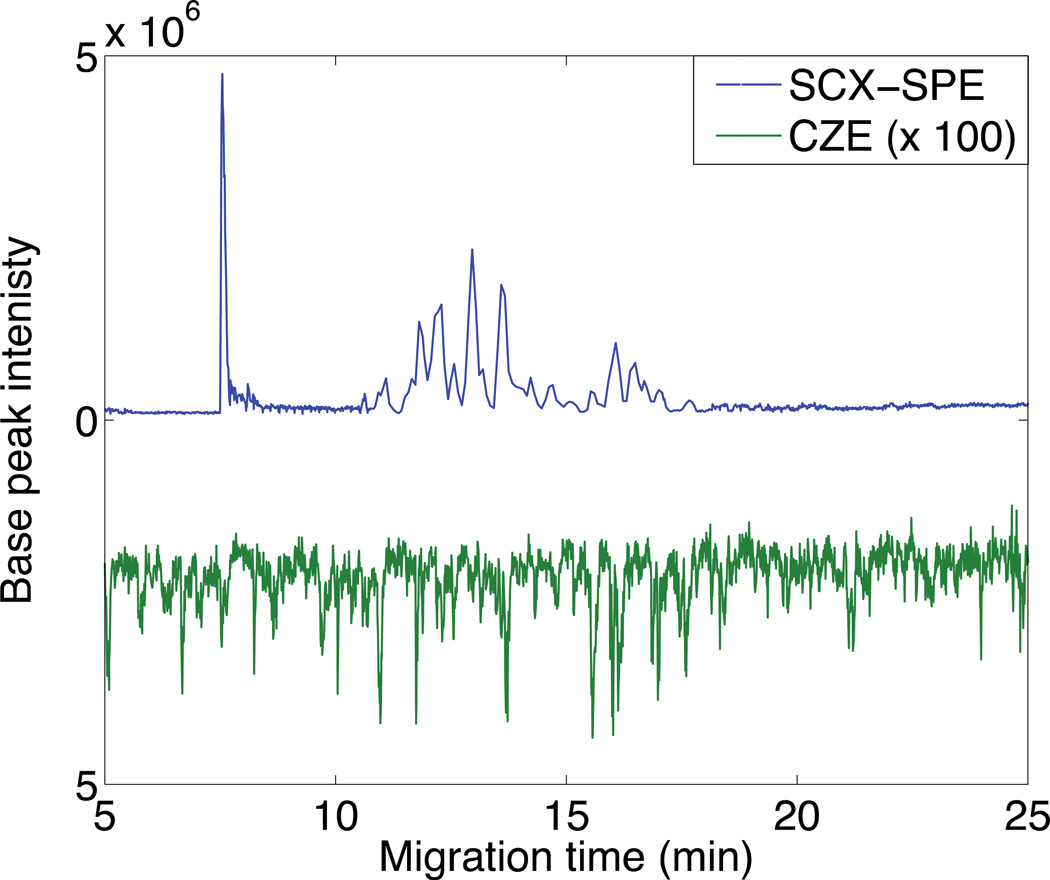
Fig 7.
Butterfly plot of electropherograms generated from 10−3 mg/mL E. coli digests. The blue (top) trace is the analysis of 5.5 µL of the digest using SCX-SPE-CZE-MS/MS. The green (bottom) trace is the analysis of 30 nL of the digest using CZE-MS/MS; this trace has been multiplied by 100. Other conditions are the same as Figure 5.0

