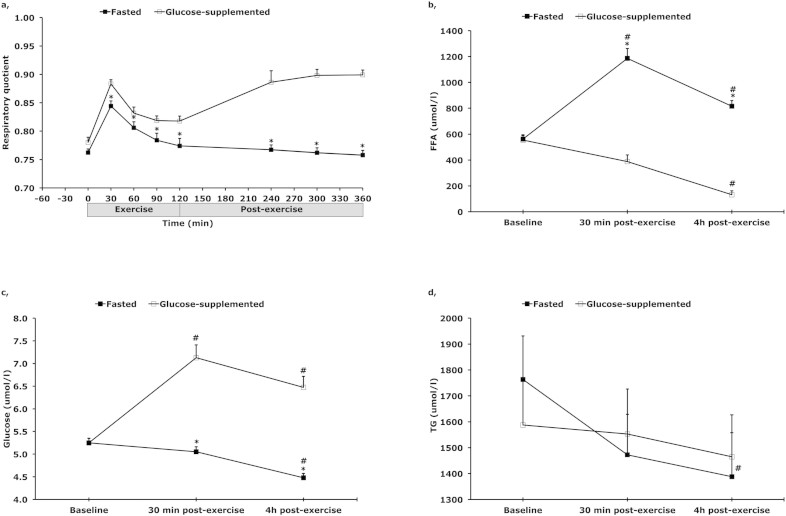
Figure 2. (a) Respiratory quotient during and after 2 h of cycling at 50% of maximal power output (Wmax) (n = 17) and plasma concentrations of (b) free fatty acids (FFA), (c) glucose, (d) and triglycerides (TG), with (open square) and without (filled square) glucose supplementation.
* p < 0.05 compared with glucose-supplemented condition. # p < 0.05 compared with baseline (t = −60). Data are mean ± SE.

