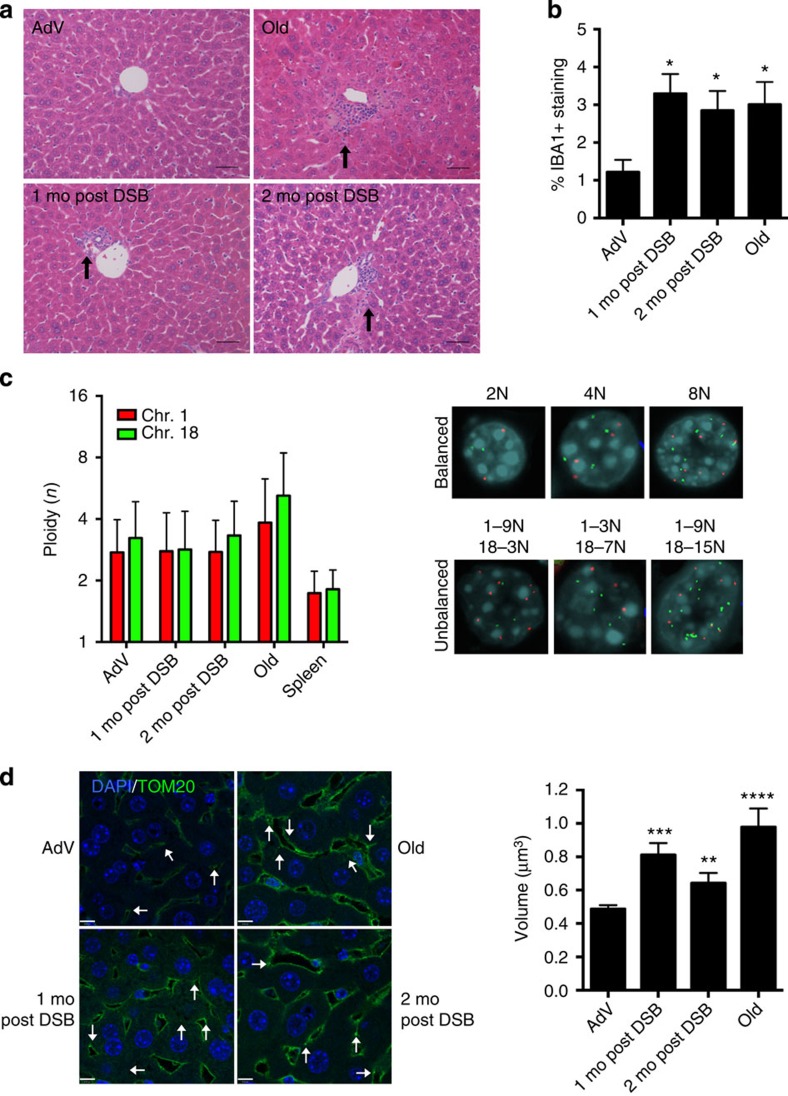
Figure 2. Phenotypic analysis of DSB-induced mouse liver.
(a) Representative haemotoxylin and eosin-stained liver sections (portal vein orientation) assessed blinded for pathological characteristics of aging at × 20 magnification. Black arrows indicate sites of lymphocytic infiltrates. (b) Quantification of activated macrophages determined by percentage of IBA1 staining. Data shown represents the mean±s.e.m. from three images per n, where n=4 for all cohorts. (c) Dual-colour interphase FISH was performed on liver sections. Ploidy for chromosome 1 (red) and chromosome 18 (green) was determined for 100 hepatocytes per n where n=3 for all cohorts. The ploidy of each chromosome was plotted as mean±s.d. Representative images are shown for cells with balanced chromosome ploidy for 2, 4 and 8 N and unbalanced cells. (d) Mitochondrial volume was quantified by immunofluorescent staining for TOM20 (green), a mitochondrial membrane-bound protein and nuclei (blue) and analysed by confocal microscopy. White arrows indicate analysable mitochondria after background noise subtraction from z-stack. Mean volume (in x–y–z planes) was calculated for eight images per n (>2,000 mitochondria), where AdV, 1 mo, 2 mo post DSB n=4 and old n=3. Data shown represents the mean±s.e.m. Scale bar, 8 μM. P values were determined using the Kruskal–Wallis test to AdV samples followed by a post hoc Dunn's test. *P<0.05, **P<0.01, ***P<0.001, ****P<0.0001. Mo, months.

