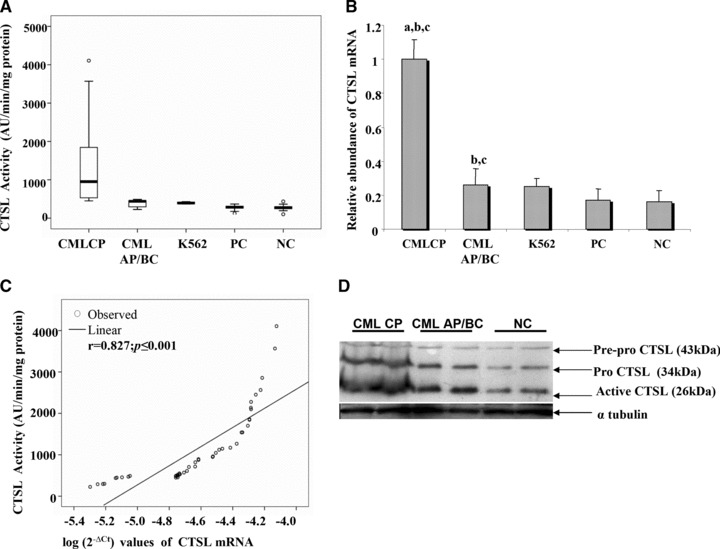
Fig 1.

Activity and expression of CTSL expression in CML patients. (A) Box plot representation of CTSL activity in CML patients. (B) Relative abundance of CTSL mRNA in CML patients and controls. (a) Significantly higher compared to CML AP/BC as well as K562 cells; (b) significantly higher compared to PCs; (c) significantly higher compared to normal healthy controls (NC) (P # 0.001, Mann-Whitney U-test). (C) Correlation between activity and mRNA expression of CTSL in CML patients (Pearson correlation analysis) (D) CTSL expression in various phases of CML. Immuno-blotting of CTSL protein in PBMCs isolated from representative CML CP, CML AP/BC and NC samples was carried out as described in Materials and methods. Simultaneously, a-tubulin was also detected in the same samples to serve as loading control.
