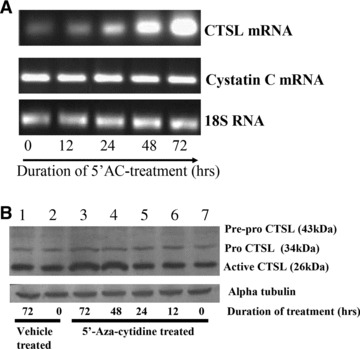
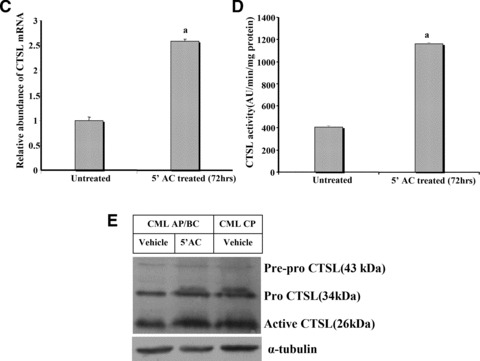
Fig 5.


Quantitative analysis of CTSL in 5′-aza-cytidine treated K562 cells. (A) Effect of demethylating agent 5′-aza-cytidine on mRNA levels of CTSL and cystatin C. Total cellular RNA isolated from K562 cells grown in the presence of 5′-aza-cytidine for different time periods was reverse transcribed and subjected to PCR using primers specific for CTSL, cystatin C or 18S RNA. The amplified products were resolved on 1.2% agarose gel and visualized under UV after staining with ethidium bromide. (B) K562 cells were grown in the presence or absence of 5′-aza-cytidine for different time periods. Cell lysates containing equal amount of protein were immuno-blotted for CTSL protein using monoclonal antibodies against it. Immuno-blotting for α-tubulin served as loading control. Lane 1: Vehicle treated K562 cells at 72 hrs; lane 2: vehicle treated K562 cells at 0 hrs; lane 3: 5′-aza-cytidine treated K562 cells at 72 hrs; lane 4: 5′-aza-cytidine treated K562 cells at 48 hrs; lane 5: 5′-aza-cytidine treated K562 cells at 24 hrs; lane 6: 5′-aza-cytidine treated K562 cells at 12 hrs; lane 7: untreated K562 cells. (C) Total RNA isolated from untreated K562 cells or after treatment with 5 μM 5′-aza-cytidine for 72 hrs was reverse transcribed and subjected to real-time PCR using amplimers specific for CTSL mRNA. a – significantly higher compared to untreated K562 cells (P≤ 0.05, Student’s test). (D) Cell lysates were prepared from untreated or 5 μM 5′-aza-cytidine treated K562 cells. CTSL-specific assay was performed with equal amount of total protein. a – significantly higher compared to untreated K562 cells (P≤ 0.05, Student’s test). (E) 5′-aza-cytidine treatment increases CTSL expression in CML AP/BC. A total of 3 × 10⁷ PBMCs isolated from CML AP/BC patients were plated in each well of a six-well dish and treated with 5 μM 5′-aza-cytidine or vehicle control. After 72 hrs the PBMCs were lysed and CTSL in the cell lysate was assessed by Western blotting and compared with its expression in untreated PBMCs isolated from CML CP patients. Immuno-blotting for α-tubulin served as loading control.
