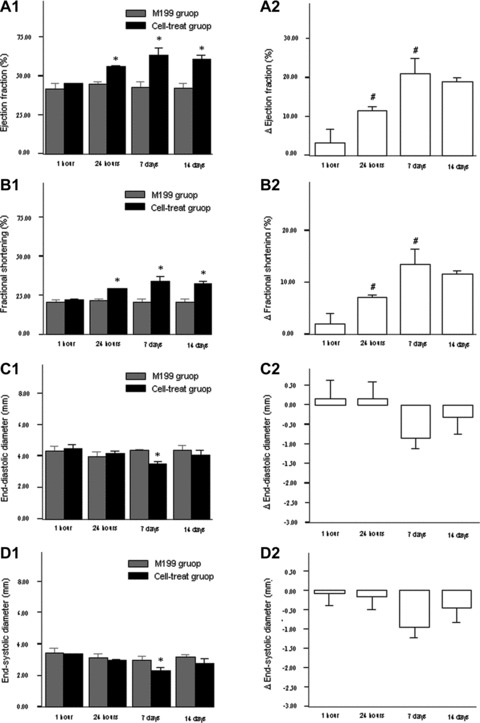
Fig 3.

The changes of cardiac function and left ventricular diameters after cell transplantation. (A1)–(D1) indicated the comparisons of cell transplantation (black column) and M199 transfer (grey column). (A2)–(D2) indicated the absolute changes of cardiac parameters from the control (M199 transfer). Bars mean standard errors. *P < 0.05 versus M199 injection group; #P < 0.05 versus left neighbour.
