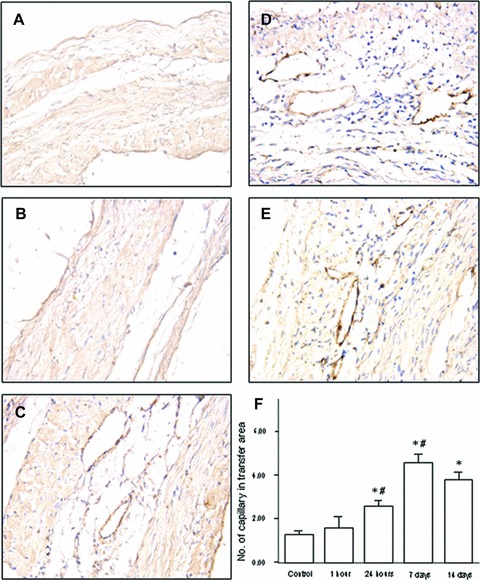
Fig 5.

Numeric density of vessels in myocardium from experimental groups at 8 weeks after MI. (A) M199 injection (the control); (B) cell therapy at hour 1 after the infarction; (C) cell therapy at hour 24 after the infarction; (D) cell therapy at day 7 after the infarction; (E) cell therapy at day 14 after the infarction. Bars mean S.D. *P < 0.05 versus the control group; #P < 0.05 versus left neighbour.
