Fig. 5.
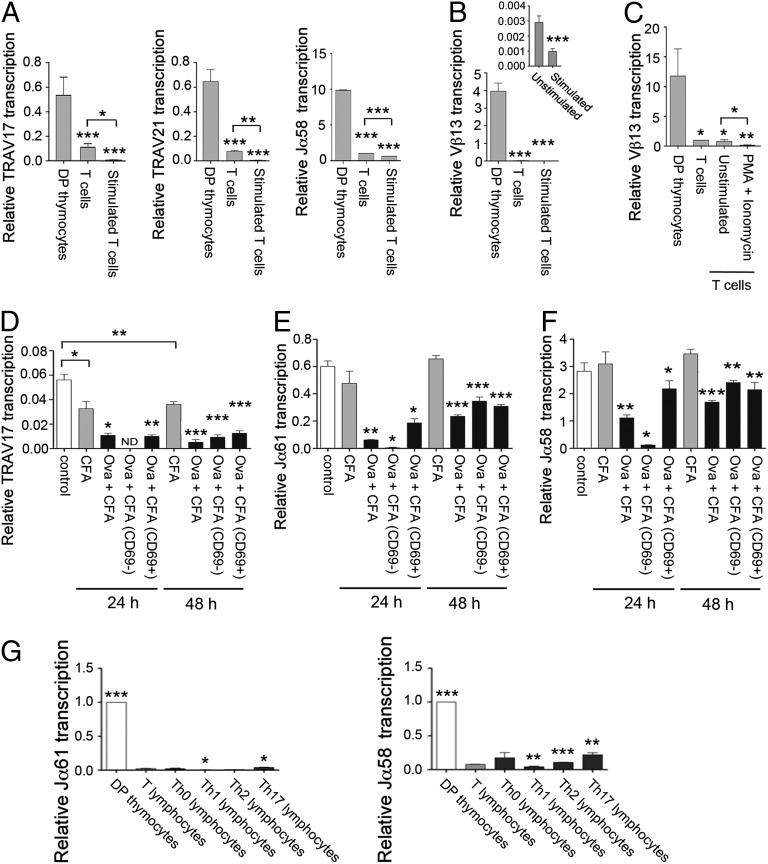
Eα and Eαi are not activated by TCR-mediated cell stimulation and Th differentiation in T lymphocytes. (A) Analysis of TRAV17, TRAV21, and Jα58 germ-line transcripts in sorted DP thymocytes and unstimulated and stimulated T lymphocytes from RxDO11.10 mice by RT-qPCR. (B) Analysis of Vβ13 transcription in EαKI Rxßtg thymocytes and unstimulated and stimulated EαKI βtg T lymphocytes by RT-qPCR. (C) Analysis of Vβ13 transcription in EαKI Rxßtg DP thymocytes, EαKI βtg T lymphocytes, and EαKI tgβ T lymphocytes left in complete medium (unstimulated) or incubated with PMA and ionomycin (PMA + Ionomycin) by RT-qPCR. Analysis of TRAV17 (D), Jα61 (E), and Jα58 (F) transcripts present in unstimulated and in vivo stimulated RxDO11.10 T lymphocytes by RT-qPCR. Indicated transcripts were compared in T lymphocytes from noninjected mice (control), CFA-injected mice (CFA), or Ova 323–339 + CFA-injected mice (Ova + CFA). Indicated transcripts were compared in sorted CD69− and CD69+ T populations from Ova 323–339 + CFA-immunized mice. (G) Analysis of Gata3, Tcfe2a, Jα61, and Jα58 transcripts in sorted DP thymocytes, T lymphocytes, and Th0, Th1, Th2, and Th17 populations from RxDO11.10 mice by RT-qPCR. The results were normalized to those for Actb and represent the mean ± SEM of duplicate RT-qPCR from three independent experiments. Two-tailed Student’s t tests were used to determine the statistical significance between the values of the RT-qPCRs from DP thymocytes vs. T lymphocytes (A-C), from unstimulated vs. stimulated T lymphocytes (A–F), and from T lymphocytes vs. DP thymocytes or Th populations (G) (*P < 0.05, **P < 0.005, and ***P < 0.0005).

