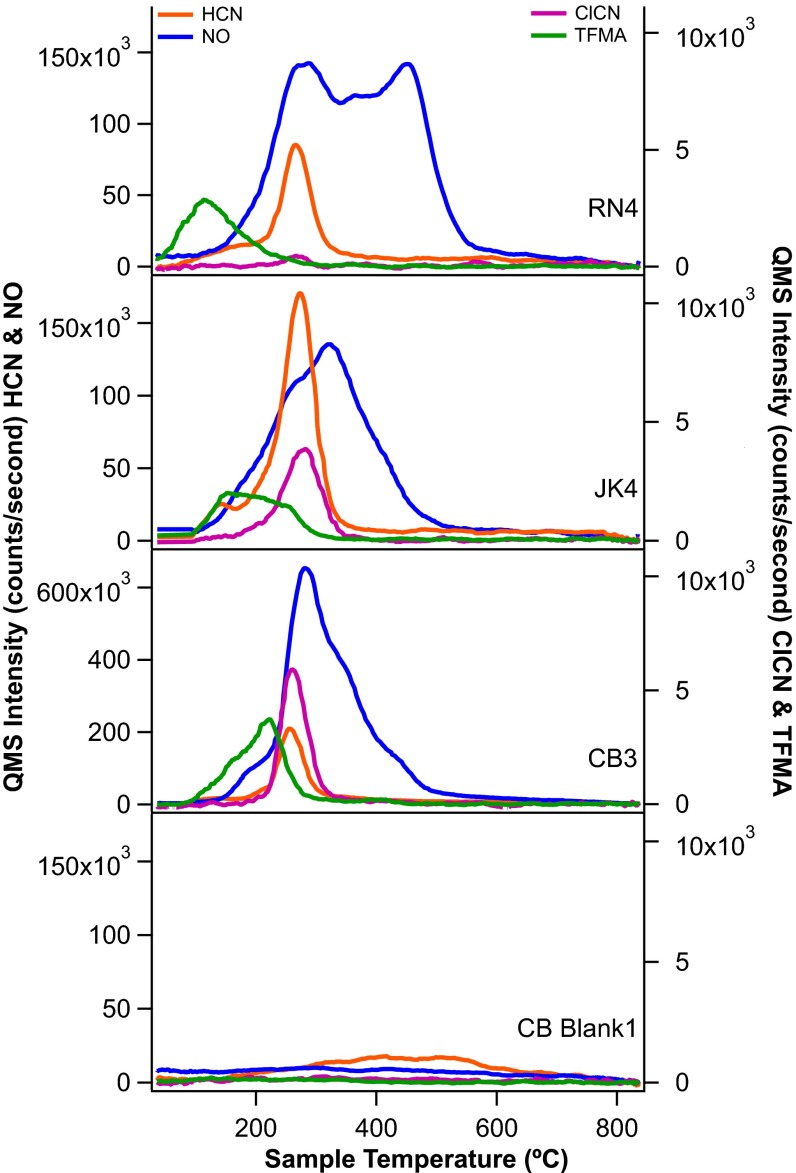
Fig. 1.
Representative EGA pyrograms from RN, JK, and CB. Highest abundance species NO (blue) and HCN (orange) plotted as m/z 30 and 27, respectively, on left axis; low-abundance species ClCN (purple) and TFMA (green) plotted as m/z 61 and 127 on the right axis. Note the change in scale on the left axis for CB3, as NO was significantly more abundant in CB samples than at either RN or JK.

