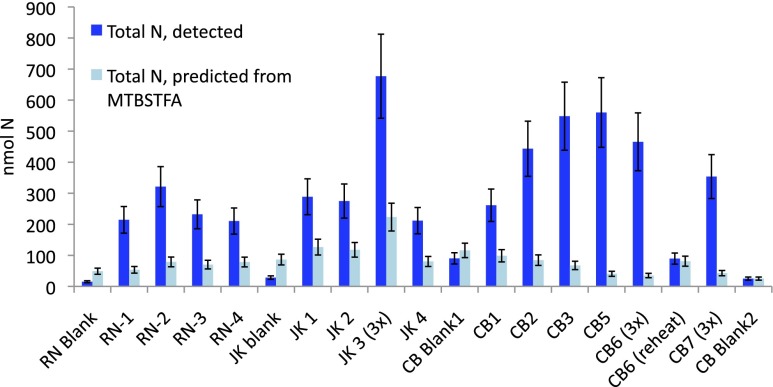
Fig. 3.
The total nanomoles of N in the sum of all N species detected (NO, HCN, ClCN, TFA, TFMA; Table 1) in blue, compared with the worst-case scenario prediction of nanomoles of N contributed by MTBSTFA (Table 1 and SI Text) in light blue. In blanks, except for CB-Blank2, the estimate of MTBSTFA-derived N is greater than actual N detected. CB samples had the largest abundance of detected N species, and the lowest percentage N contribution from MTBSTFA (Table 1).

