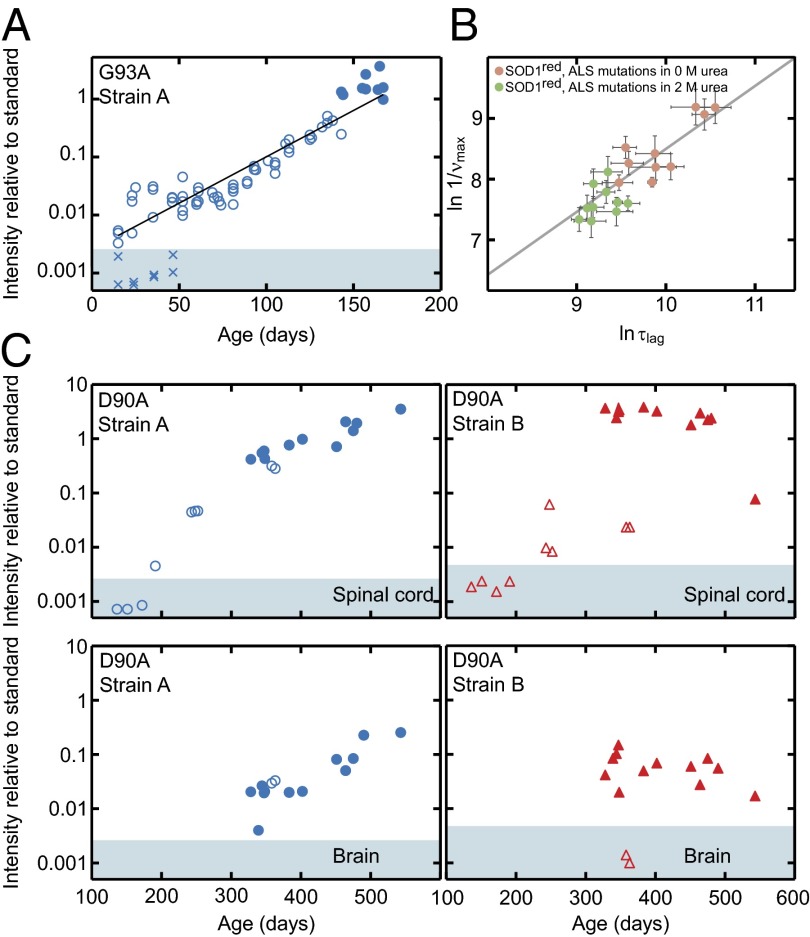
Fig. 5.
In vivo aggregation kinetics of hSOD1 in spinal cord and brain. (A) Strain-A aggregation in spinal cord of hSOD1G93A mice shows essentially simplistic exponential growth (open and filled circles). The filled circles represent end-stage mice. X indicates brains from some of the young hSOD1G93A mice, showing absence of detectable aggregates. Brains contain as much mutant hSOD1 as spinal cords in hSOD1G93A mice (26). (B) In vitro aggregation data of monomeric reduced apo-hSOD1 variants, destabilized by single point mutations in buffer (pink circles) and 2 M urea (green circles), show a strong correlation (slope δlogτlag/δlogνmax = 1.03 ± 0.18, r = 0.88) between the apparent lag time, logτlag, and the aggregate growth rate, δlogνmax, indicating exponential kinetics analogous to the in vivo data in A. (C) Time courses of the simultaneous strain-A and -B aggregation in hSOD1D90A mice (open symbols, nonsymptomatic; closed, end-stage mice). The top panels show data from spinal cord, and the bottom panels show the matching samples from brain. The shaded areas in A and C indicate staining intensities below means + 2 SD of the results for nontransgenic controls (Table S1).

