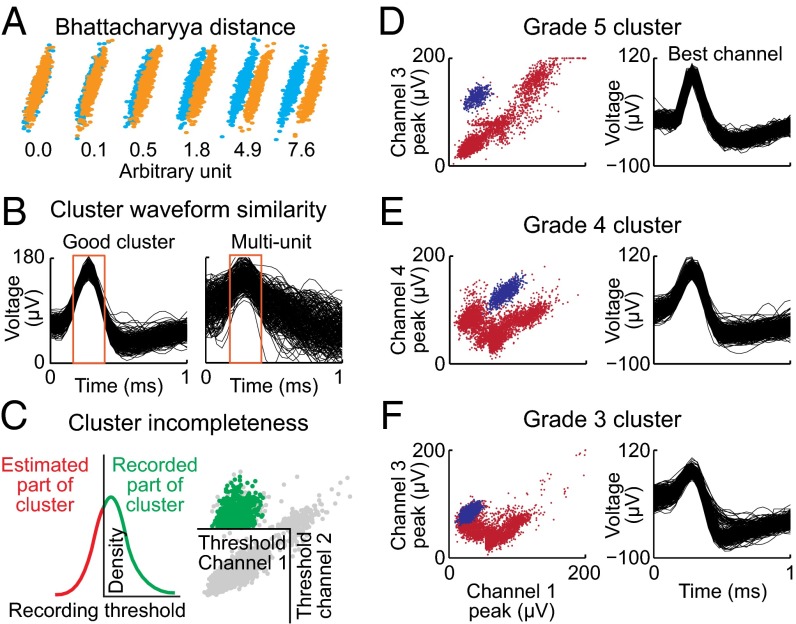
Fig. 5.
Grading of cluster quality. (A) Two overlapping, normally distributed clusters are shown (blue and orange dots). Bhattacharyya distance accurately measures the level of overlap between the clusters. (B) The analysis was performed with time window corresponding to the widths at half peak (red rectangles). Spikes are normalized, and the error of projection to the mean waveform is calculated. (C) The level of cluster incompleteness is quantified, identifying asymmetrical clusters that result from inappropriate thresholds for spike detection. (D–F) Three examples of final cluster grades (blue clusters): an excellent (grade 5) cluster (D), a mediocre (grade 4) cluster (E), and a separable (grade 3) cluster (F).

