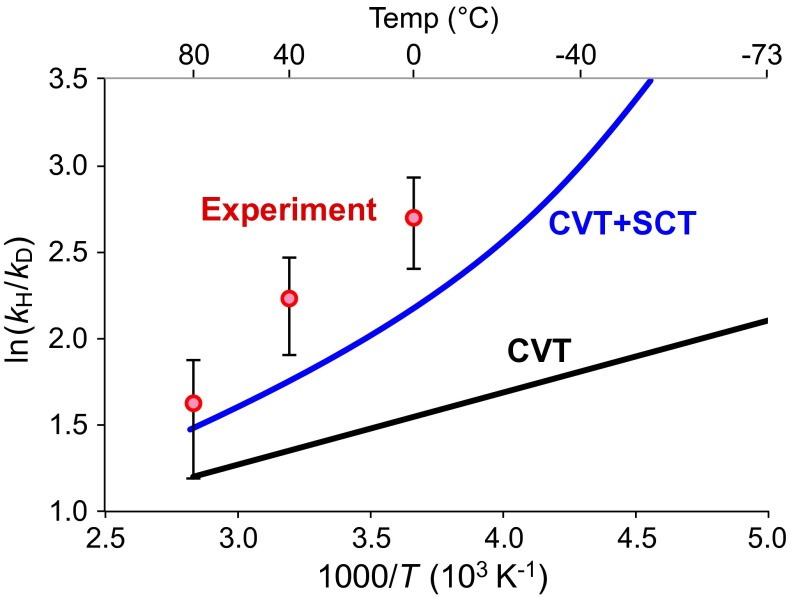
Fig. 3.
Arrhenius plots of ln(KIE) vs. 1,000/T for the H-transfer step in Fig. 1, computed by POLYRATE with the GAUSSRATE interface to Gaussian, using B3LYP/6–31++G** with PCM water solvation. Red: experimental points ± 1 SD; black: computed by canonical variational transition state theory (CVT); blue: computed by CVT+SCT.

