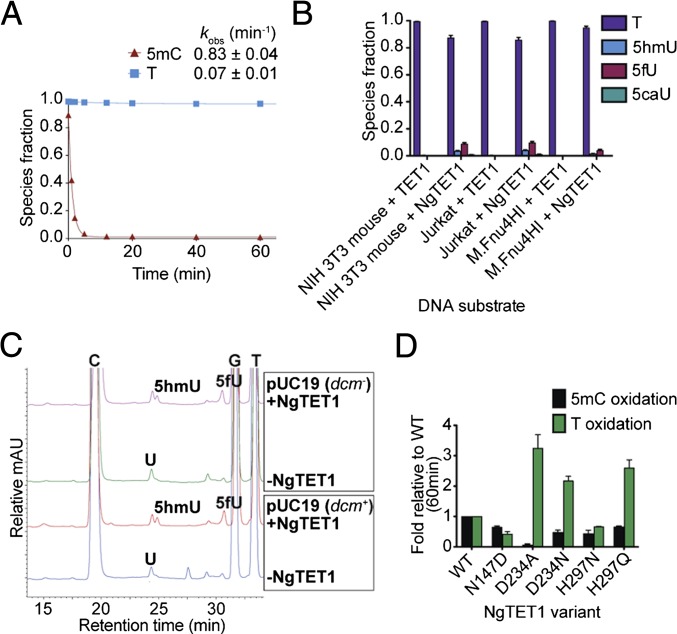
Fig. 2.
T-oxygenase activity of NgTET1. (A) Kinetic time course depicting the decay of 5mC or T for a reaction with 4 μM NgTET1 and 2 μM oligo C5mCGG. Reaction species were detected and quantified by LC-MS (Agilent 1200). The data are fit to a single exponential and the observed rate constants with SEM are provided. (B) Quantification of oxidized T reaction species using 6.7 μM mTET1CD or NgTET1 (in Mops buffer pH 6.9) as measured by LC-MS (6490 Triple Quad LC-MS) for 0.2 μg sheared (1.5-kb) gDNA substrates. The error bars (in black) represent the SE (SEM) (n ≥ 3). (C) LC-MS (Agilent 1200) traces comparing T-oxygenase activity by NgTET1 (10 μM) on methylated and unmethylated pUC19 plasmid DNA (2.5 μg). (D) LC-MS (Agilent 1200) quantification of 5mC or T after a 1-h reaction of 4 μM NgTET1 WT or variant proteins with 2 μM oligo C5mCGG. Error bars (in black) represent the SEM (n ≥ 3).

