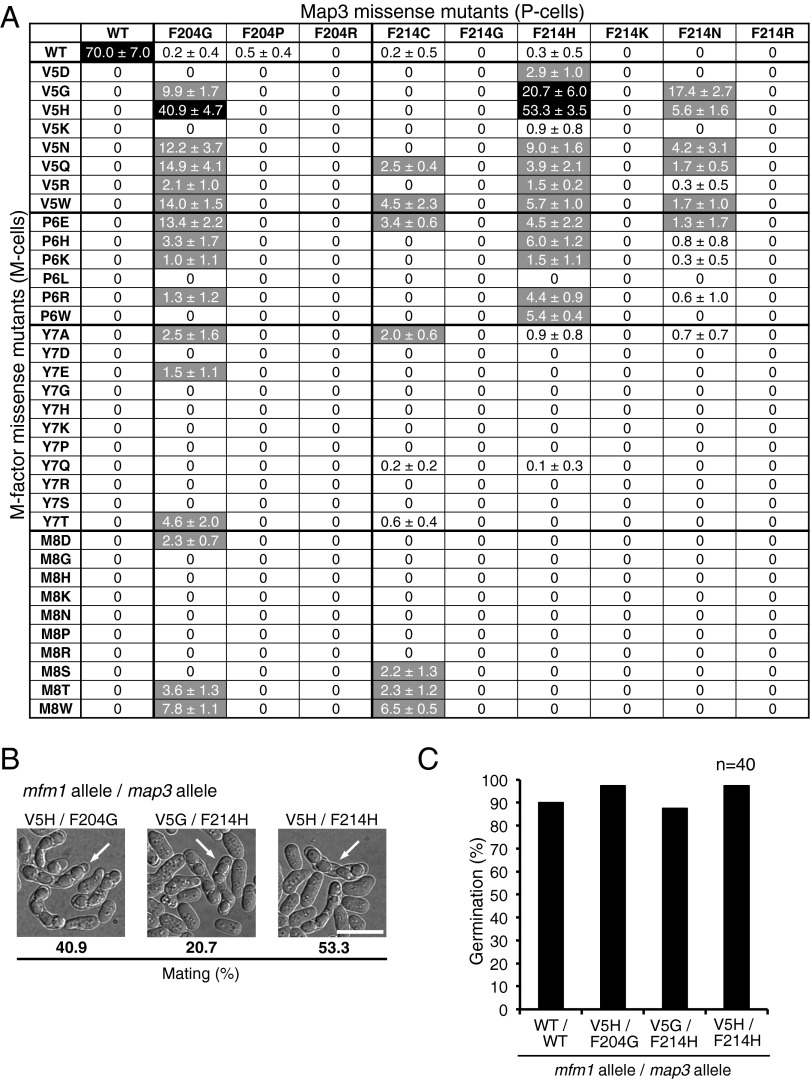
Fig. 2.
Mating ability of the cross between map3 missense mutants and sterile M-factor mutants. (A) Efficiency of mating between 35 M-type M-factor mutants and 9 P-type map3 mutants. The M-factor mutants are shown on the left, and the Map3 mutants are shown on the top. The map3 missense mutants (P-type cells) and M-factor missense mutants (M-type cells) were crossed in all combinations. The percentage of zygotes plus asci was determined after incubation for 2 d on malt extract medium agar. Three independent samples were inspected (at least 200 cells each) (SI Materials and Methods). Means with SDs were calculated. Mating frequency is also indicated as a three-level grading: black, >20%; gray, 1–20%, and white, <1% (almost sterile). (B) Microphotographs of three novel mating-type pairs. White arrows indicate typical asci. (Scale bar: 10 µm.) (C) Germination of spores produced by mating between novel mating-type pairs. Spores were isolated and inoculated on nutrient medium (YEA) by micromanipulation. Spore-derived colonies were observed after incubation for 3 d. The percentage of germination with the number of tested spores (n = 40) is shown.

