Fig. 3.
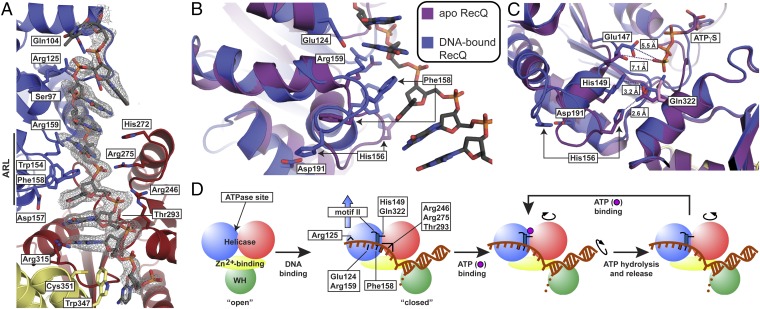
CsRecQ ssDNA-binding and DNA-translocation/unwinding model. (A) CsRecQ/ssDNA interface. An Fo−Fc DNA omit electron density map (contoured to 2σ) is shown in gray with the refined DNA model overlaid. Side chains of residues within 3.3 Å of ssDNA or that form new interactions in the DNA-bound form of RecQ are labeled. Domain coloring is as in Fig. 1. (B) Superposition of the free EcRecQ (purple) (10) and DNA-bound CsRecQ (blue) structures reveal DNA-dependent ARL rearrangement. Residues within the ARL that engage ssDNA or that appear to stabilize the DNA-bound form of the ARL are labeled. (C) Realignment of motifs II and VI by DNA binding-induced ARL remodeling in CsRecQ. EcRecQ and CsRecQ catalytic core structures are colored as in B, and the region around Gln322 was used to align the structures. In the free state, the side chain of Gln322 (pink) is oriented toward the empty ATP-binding site, whereas in the ATPγS-bound structure, Gln322 (purple) rotates to interact with His156 (10). In the DNA-bound state, Gln322 (blue) forms a new interaction with His149 of motif II, and His156 interacts with Asp191. Distances between Glu322 and His156 or His149 and between the carboxyl group of Glu147 and the gamma phosphate position observed in the EcRecQ/ATPγS (10) structure are shown. (D) Cartoon schematic of the RecQ DNA-binding and -translocation/unwinding mechanism. DNA binding (first step) induces changes described in the presented structure; key residues with roles in DNA binding and/or unwinding are depicted as black lines. Subsequent steps linking ATPase activities to domain movements involved in translocation are based on inchworm models from SF1 and SF2 helicases (20, 21, 33, 44). An ssDNA base is boxed to demonstrate its movement during translocation.

