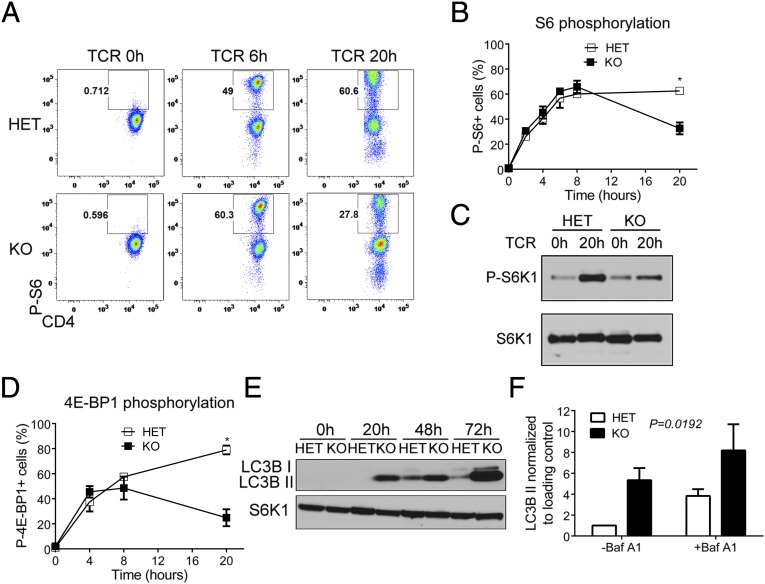
Fig. 3.
Dynamin 2 sustains mTORC1 signaling and limits autophagy. Naive CD4 T cells from Dnm2 HET and KO mice were activated with α-CD3 and α-CD28 mAbs for the indicated time periods. (A and B) Phosphorylated ribosomal protein S6 (P-S6) was detected in CD4 T cells from Dnm2 HET and KO mice by intracellular flow cytometry. Representative dot plots (A) and frequency (B) of P-S6+ Dnm2 HET and KO cells are shown. (C) Phosphorylation of S6K1 was measured in Dnm2 HET and KO CD4 T cells by Western blot. (D) Phosphorylated 4E-BP1 was detected in CD4 T cells from Dnm2 HET and KO mice by intracellular flow cytometry. (E) LC3B protein expression in activated CD4 T cells from Dnm2 HET or KO mice was measured by Western blot. The nonlipidated (I) and lipidated (II) isoforms of LC3B are indicated. S6K1 was used as a loading control. (F) Dnm2 HET and KO CD4 T cells were activated for 48 h in the absence or presence of the lysosomal inhibitor bafilomycin A1 (Baf A1) for the last 4 h of culture and LC3B II amounts quantified by densitometry (n = 3). All error bars represent SEM. *P < 0.05 by unpaired Student's t test (B and D) or one-way ANOVA (F). Results are representative of or combined from two (A, B, and D), three (C and F), or five (E) experiments.

