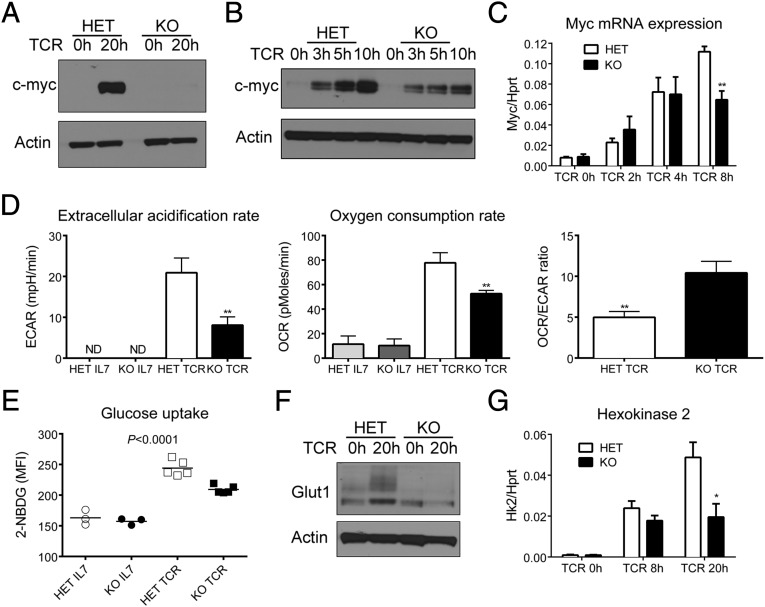
Fig. 4.
Reprogramming of T-cell metabolism through myc is dependent on dynamin 2. Naive CD4 T cells from Dnm2 HET and KO mice were activated with α-CD3 and α-CD28 mAbs. (A and B) Myc protein expression in Dnm2 HET and KO CD4 T cells. Actin was used as a loading control. (C) Myc mRNA expression in CD4 T cells from Dnm2 HET and KO mice (n = 4). mRNA expression was normalized to Hprt. (D) Metabolic analysis using the Seahorse extracellular flux analyzer. The extracellular acidification rate (ECAR), oxygen consumption rate (OCR), and OCR/ECAR ratio were determined in CD4 T cells cultured in IL-7 or stimulated for 20 h (TCR). (E) Glucose uptake in CD4 T cells cultured in IL-7 or stimulated for 20 h through the TCR. Graph shows the mean fluorescence intensity (MFI) of 2-NBDG staining. (F) Glut1 protein expression in activated CD4 T cells from Dnm2 HET or KO mice was measured by Western blot. (G) Hexokinase 2 (Hk2) mRNA expression in CD4 T cells from Dnm2 HET and KO mice (n = 5). All error bars represent SEM. *P < 0.05, **P < 0.01 by unpaired Student's t test (C, D, and G) or one-way ANOVA (E). Results are representative of or combined from two (D–F), three (B and C), four (G), or five (A) experiments.

