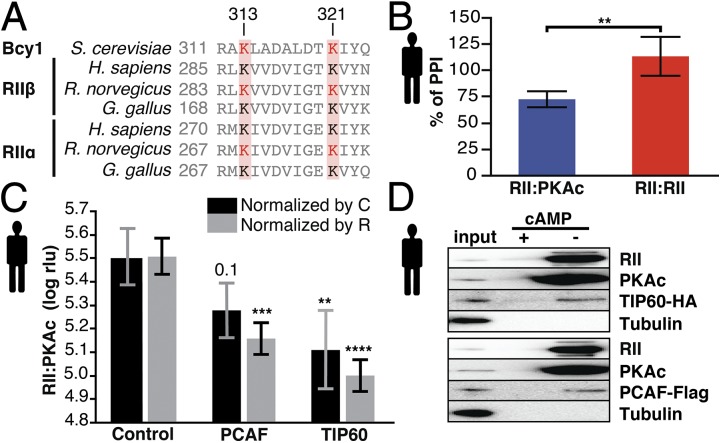
Fig. 5.
Acetylation regulates PKA in yeast and humans. (A) Sequence alignment of the PKA regulatory subunits. The displayed region contains two conserved (red boxes) and acetylated lysine (red residues) positions. (B) HDAC inhibition using trichostatin A (TSA) (1 µM, 3 h) affects PKA type II complex formation in mammalian cells as quantified using the Rluc PCA (22). Treatment with TSA diminishes complex formation of RII:PKAc, but the RII:RII interaction is not affected. **P < 0.01; Welch’s test. Bars indicate average percent of PPI, and error bars indicate SD; n = 5. (C) Mammalian PKA complex formation decreases by up to 55% and 69% upon PCAF or TIP60 overexpression, respectively. The signal (expressed in relative light units, rlu) was normalized by the expression of either the R (RII-F1) or the C (PKAc-F2) subunit (Fig. S7) and was log transformed. **P < 0.01, *** P < 0.001, **** P < 0.0001; blocked Dunnett’s test. Bars show average log rlu; error bars indicate SD. n = 5. Control, mock treatment. (D) Precipitation of cAMP agarose protein from HEK293 cells transiently overexpressing TIP60 (n = 3) or PCAF (n = 2). Tubulin was used as a negative control.

