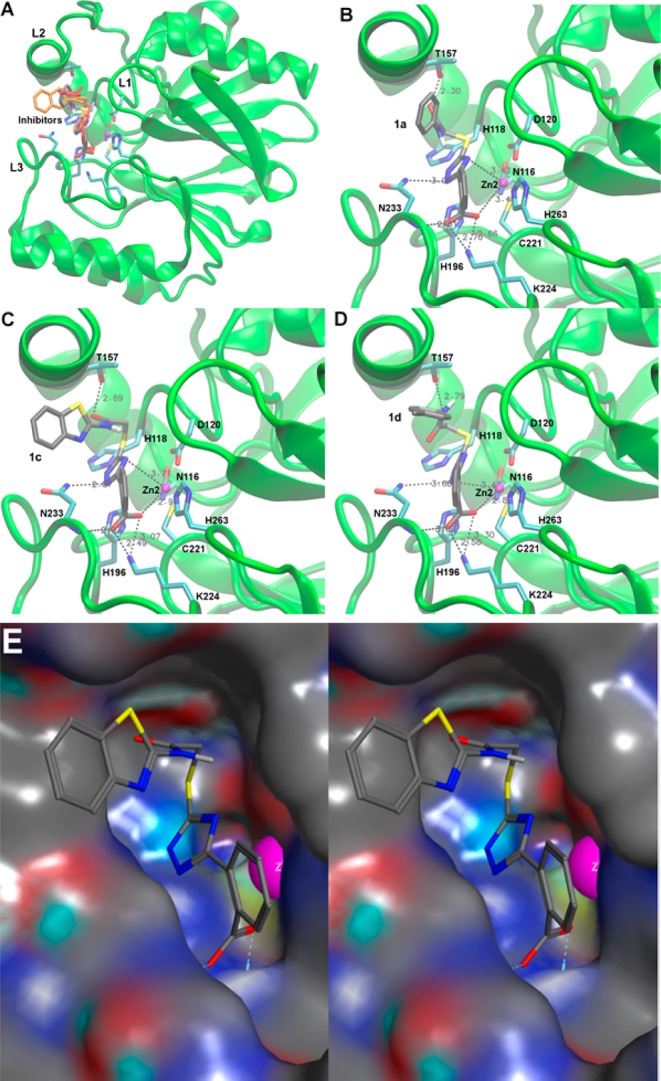
Figure 3.

Low energy conformations of 1a, 1c, and 1d docked into the active site of CphA (PDB code 2QDS(13)). (A) Overview of the entire enzyme with loops L1, L2, and L3 (labeling according to Garau et al.33) flanking the active site. The enzyme backbone is shown as a cartoon in green and selected residues are shown as sticks colored by atom (C, cyan; N, blue; O, red; S, yellow) and labeled at Cα. The Zn(II) ion is shown as a magenta sphere. All three inhibitors are superimposed: 1a as sticks colored by atom (same colors as for protein residues except C in gray), 1c as orange sticks, and 1d as red sticks. (B–D) Detailed views of 1a, 1c, and 1d, respectively, with key residues displayed and interactions between the inhibitors and protein residues indicated by dashed lines. Panels A–D were generated with VMD.34 (E) Stereo view of 1c (same coloring and conformation as in panel C) with the enzyme represented as a surface with neutral areas in gray, positively charged areas in blue, and negatively charged areas in red. Zn2 is shown as a magenta sphere. The figure was generated with MOE.35
