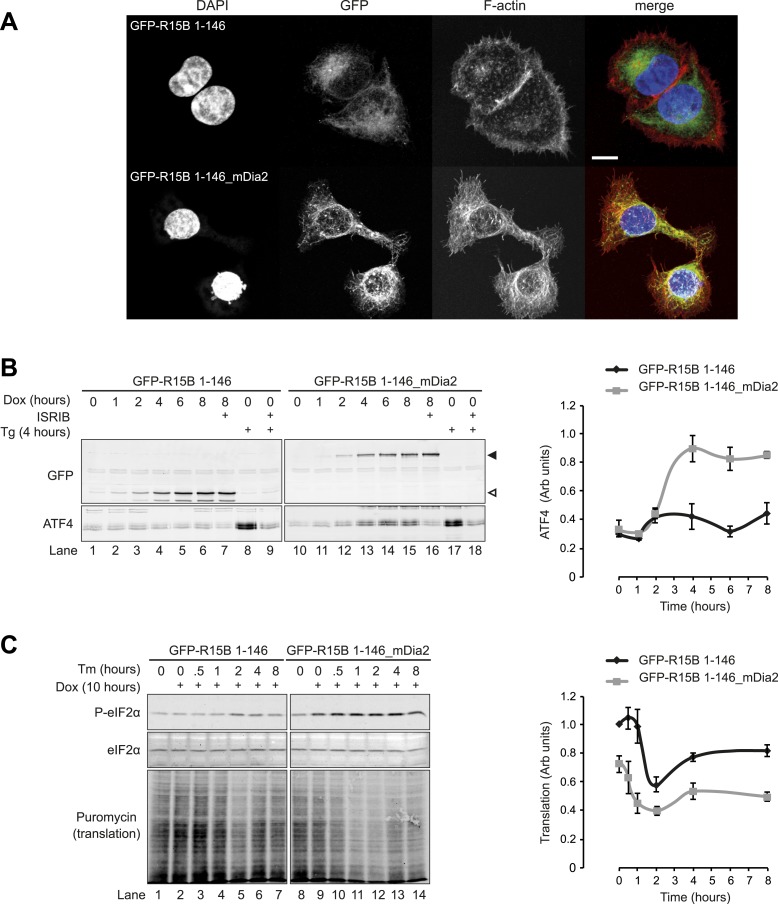
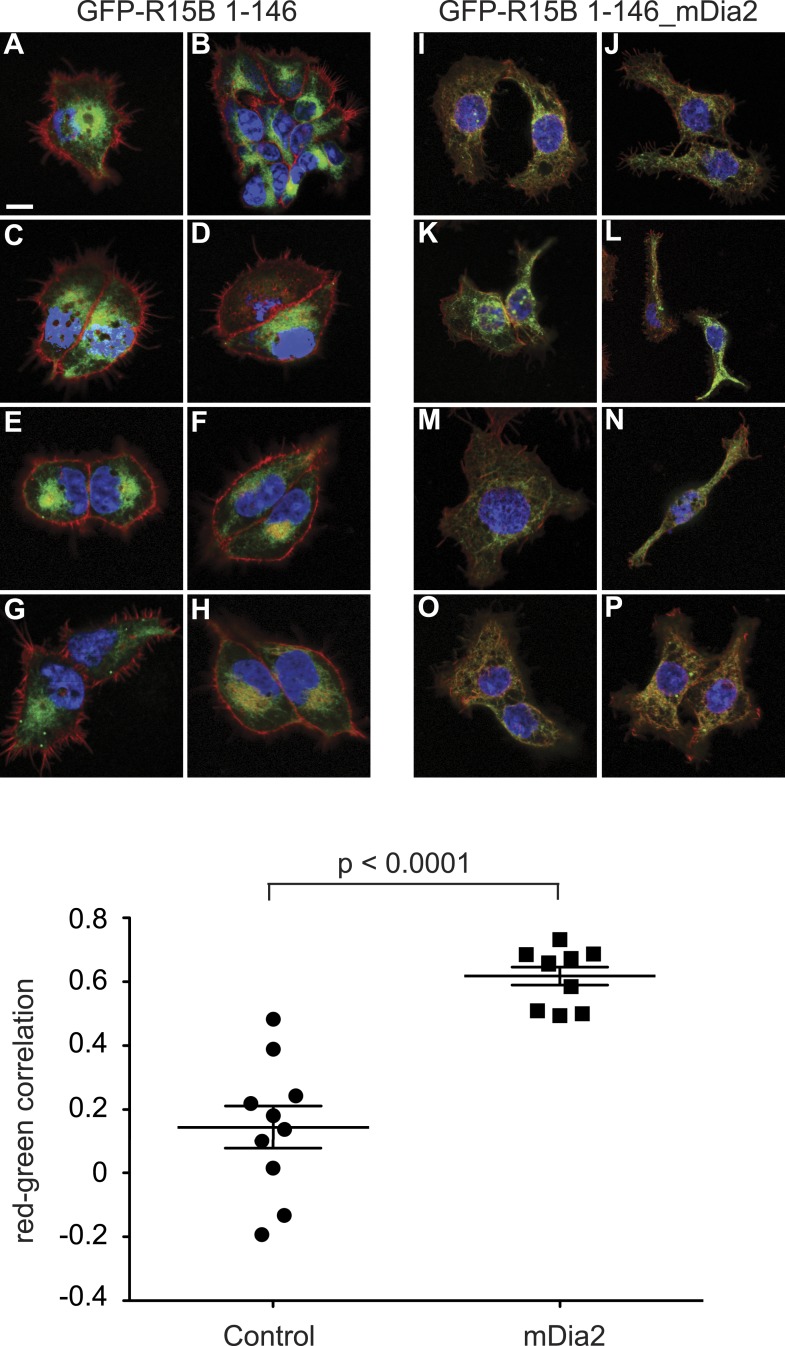
Figure 9. Localised changes in the polymeric status of actin modulate the sensitivity of the ISR.
(A) Fluorescence microscopy image of Flp-In T-REx HEK293 cells treated with 1 µg/ml doxycycline for 12 hr to express either ER membrane-localised GFP (GFP-R15B 1–146) or ER membrane-localised GFP-mDia2 fusion (GFP-R15B 1–146_mDia2) then fixed and stained with Alexa-Fluor 568 phalloidin and imaged by confocal microscopy. Bar = 5 µm. (B) Immunoblot for GFP and ATF4 in lysates of GFP-R15B 1–146 or GFP-R15B 1–146_mDia2 Flp-In T-REx HEK293 cells following treatment with doxycycline (Dox) 0.1 µg/ml for indicated times or with ISRIB 100 nM and or thapsigargin 300 nM for 4 hr. Immunoreactivity to ATF4 was quantified using ImageJ software (ATF4 Intensity). Proteins of the expected sizes are marked with a solid triangle GFP-R15B 1–146_mDia2 or an open triangle GFP-R15B 1–146. (C) Immunoblot for P-eIF2α, total eIF2α, and puromycin in lysates of GFP-R15B 1–146 or GFP-R15B 1–146_mDia2 Flp-In T-REx HEK293 cells following pre-treatment—if indicated with doxycycline (Dox) 0.1 µg/ml for 10 hr followed by treatment with tunicamycin 2.5 µg/ml for indicated times. 10 min prior to harvesting, puromycin was added to the culture medium at a final concentration of 10 µg/ml. Immunoreactivity to puromycin within lysates served as a marker of protein translation and was quantified using ImageJ software (Puromycin intensity). Accompanying graphs of mean ± SEM of n = 3 independent repeats.


