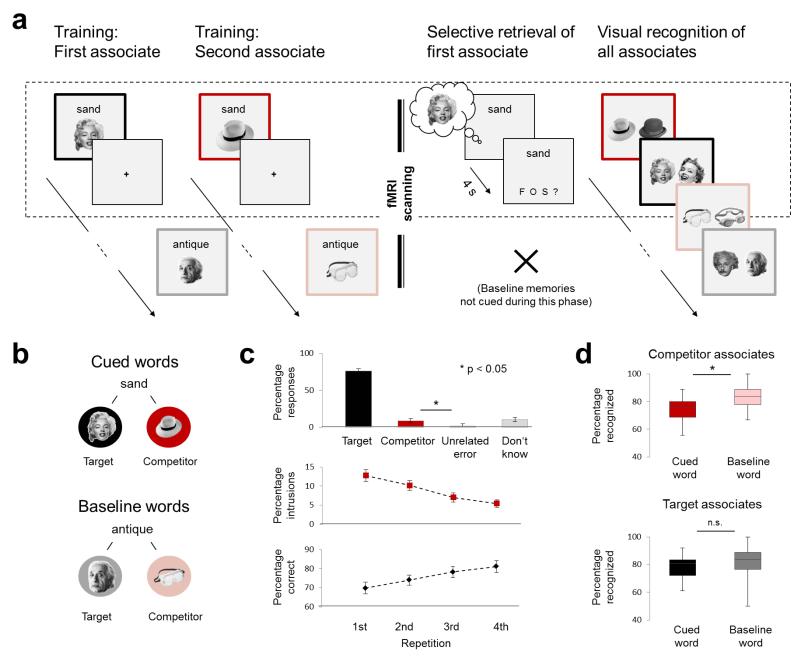
Figure 1. Schematic of the procedure (excluding initial familiarization and the pattern localizer) and behavioural results.
(a) Participants were trained on novel word-picture pairs, each word being linked with two associates. During scanning, participants were cued with a word (4 times each across the entire selective retrieval task), and were asked to retrieve the first associate that they studied (the target), with the second associate (the competitor) assumed to interfere. On each trial they classified the memory that came to mind as being a face (“F”), object (“O”), scene (“S”), or unsuccessful retrieval (“?”). Some of the originally trained targets were not tested during this phase, and served as a baseline against which we assessed the impact of selective target recall. We expected to observe a disruptive aftereffect of selective retrieval on competing associates on a forced-choice visual recognition task that required participants to distinguish studied pictures from familiar foils. The coloured frames illustrate item types and were not visible to participants. (b) Illustration of the associative relationships assumed to have been formed after training, and of the different types of items created by the experimental procedure. (c) Behavioural data from the selective retrieval phase. The upper panel shows the proportion of trials on which participants correctly selected the category of the target (e.g. face), or incorrectly selected the category of the competitor (e.g. object), the third (unrelated) category not linked to the current cue word (e.g. scene), or “don’t know.” The lower panels show the number of intrusion errors (competitor responses) and the corresponding increase in correct responses across repetitions (mean +/− SEM) (d) Behavioural results from the visual recognition memory task. The upper panel shows the disruption of discrimination performance for competitors, compared with their matched baseline items. Boxes reflect median (+/− 1st and 3rd quartile, error bars show minimum and maximum).

