Figure 7.
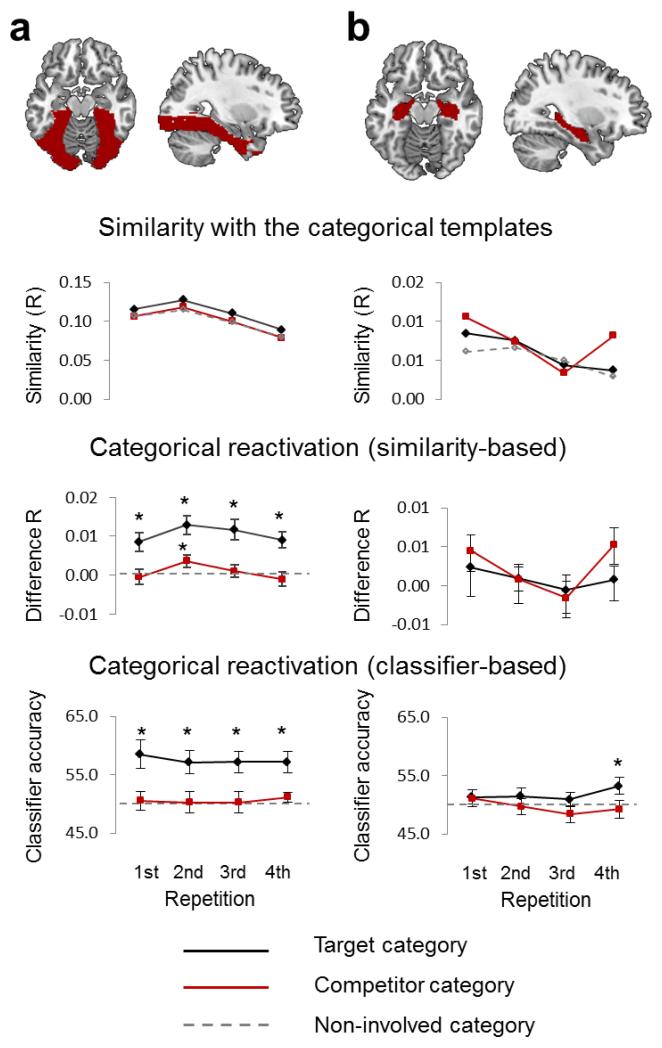
Results from the categorical multivariate analyses in (a) ventral visual cortex and (b) the hippocampus. The upper line plots show raw similarity (Pearson correlation) values between selective recall patterns and the canonical template of the target category (black solid), the canonical template of the competing category (red solid), and the canonical template of the currently non-involved category (grey dotted), averaged across trials and participants. The middle plots show the same measures transformed into differences in categorical activation relative to category that was not involved on a given trial. The lower row shows the results from a complementary categorical analysis using linear pattern classifiers (SVMs), with plotted means reflecting classifier accuracy in determining the target and competitor category (against the baseline, non-involved category). Both approaches converge in indicating highly significant categorical target reactivation in ventral visual cortex (but not the hippocampus), with no reliable change over repetitions. No significant below baseline suppression of the competitor’s category was evident. All measures plotted as mean +/− SEM (across subjects).

