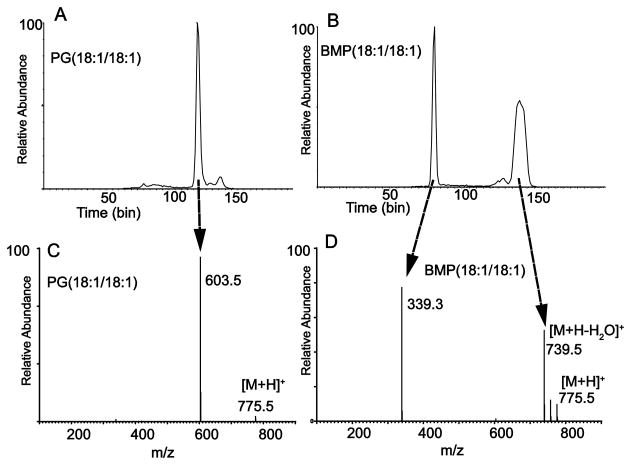
Figure 2.
Ion mobility of product ions following collisional activation of positive ions from PG and BMP. (A) Mobilogram of all product ions from CID of [M+H]+ m/z 775.5 of PG(18:1/18:1). Predominant peak at bin 120 corresponds to the diglyceride-like fragment ion at m/z 603.5. Collision energy at 15V. (B) Mobilogram of all product ions from CID of [M+H]+ m/z 775.5 of BMP(18:1/18:1). Predominant peak at bin 77 corresponds to the monoglyceride-like fragment ion at m/z 339.3 and the broad peak at bin 140 corresponds to the cluster of ions including precursor [M+H]+ and a series of one and two losses of H2O. Collision energy at 10V. (C) Product ion mass spectrum of [M+H]+ m/z 775.5 of PG(18:1/18:1). Collision energy at 5V. (D) Product ion mass spectrum of [M+H]+ m/z 775.5 of BMP(18:1/18:1). Collision energy at 10V.

