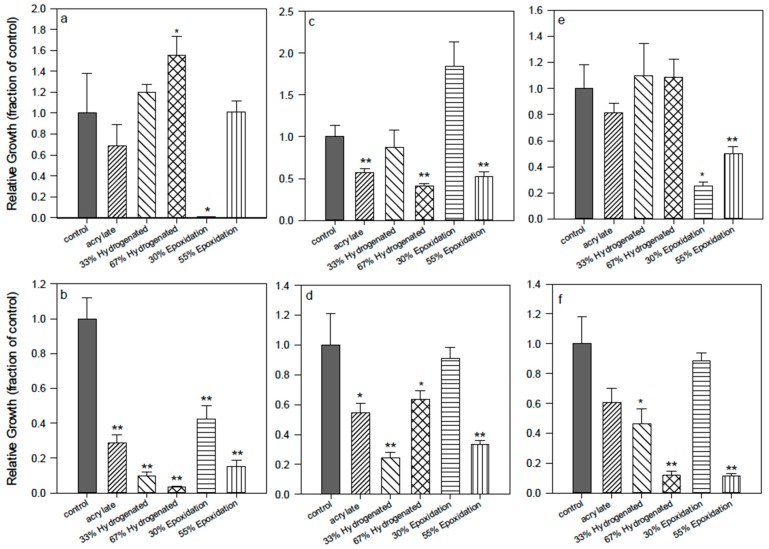
Figure 3.
Effect of hydrogenation or epoxidation of acrylate (1). 33%–67% hydrogenation = oligomer (3); 30%–55% epoxidation = oligomer (2). Pseudomonas aeruginosa (left), Staphylococcus aureus (middle), Staphylococcus epidermidis (right). (a), (c), (e) = bacteria suspended in the supernatant media; (b), (d), (f) = bacteria attached to the control (polystyrene) or polymer surface. *, difference in values significant at p ≤ 0.05, ** difference in values significant at p ≤ 0.01.

