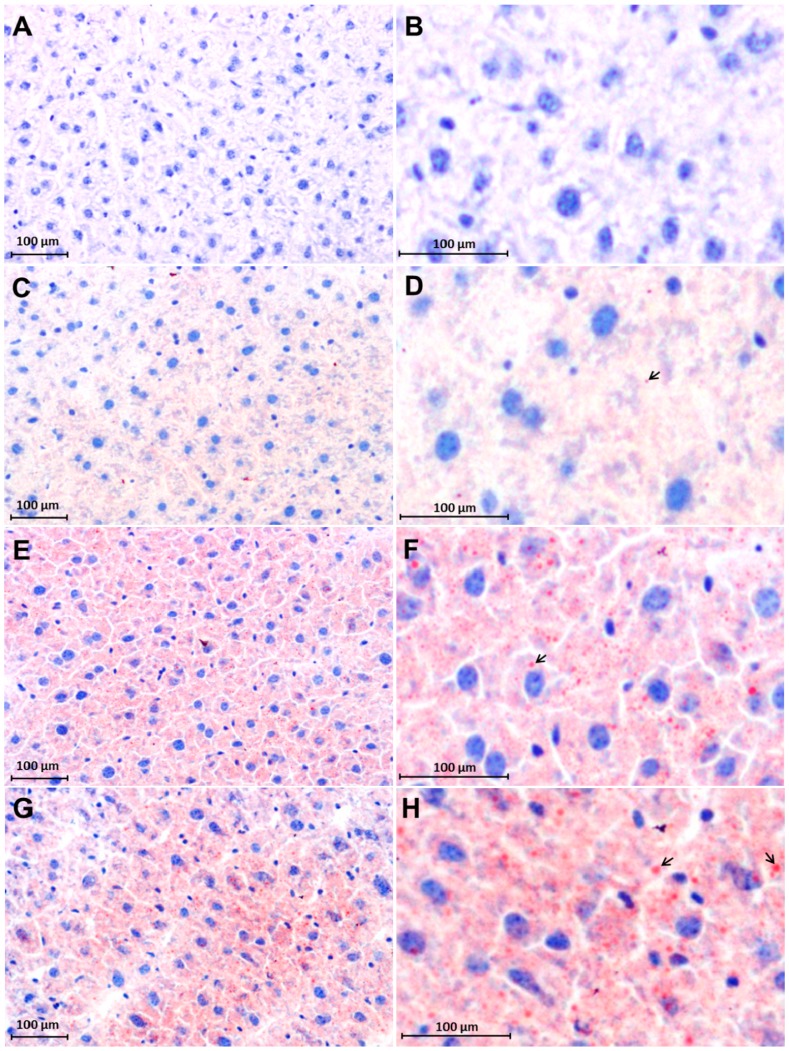
Figure 3.
Accumulation of intracellular fat visualized with Sudan III staining in cryosections of livers of sham-irradiated control and irradiated mice. Negative control (A,B); Sham-irradiated controls (C,D); 6 h post-RT (E,F) and 12 h post-RT (G,H). The intracellular accumulation of fat droplets (red color) increased with the time after irradiation. (B,D,F and H) are magnified areas of (A,C,E and G); The arrows in pictures (D,F and H) show intracellular lipid droplets. Nuclei are stained blue. Results are representative photographs of three animals and six slides per time point (original magnification, ×200).

