Figure 2.
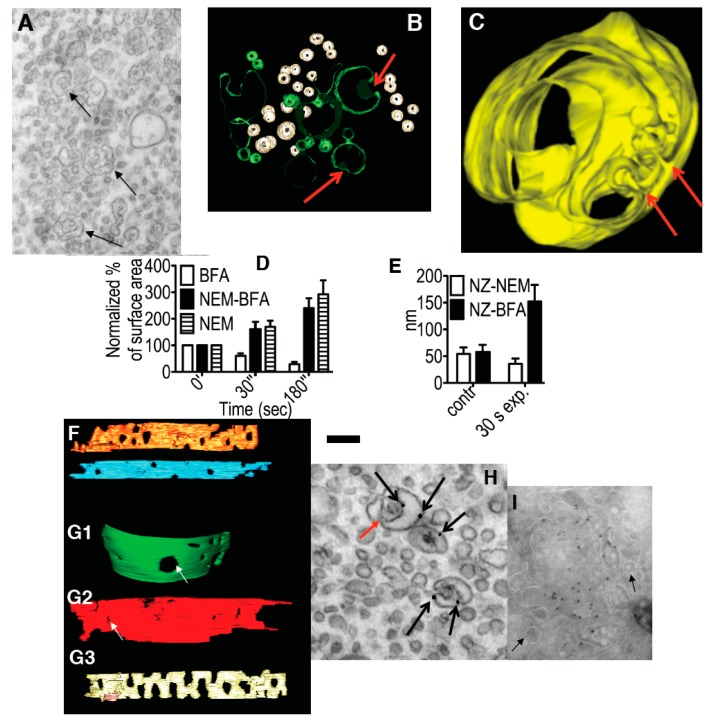
Effects of inhibition of membrane fusion on the Golgi. (A) HeLa cells 30 min after microinjection of αSNAPmu. Arrows, cisternal remnants; (B,C) Three-dimensional models of cisternal remnants after surface rendering. Arrows, invaginations. Cisternal remnants are green (B) and yellow (C). Vesicles in (B) are white; (D) Normalized surface areas of RPs versus Golgi cisternae after treatment with BFA alone (white bars), 30 s after treatment with N-ethylmaleimide (NEM) and then brefeldin A (BFA; black bars), or 30 s after NEM treatment alone (striated bars); (E) Mean diameter of cisternal pores determined using EM tomography. Each experiment was compared with its own control; (F) Cells were treated with 33 µM nocodazole (NZ) or 5 min, and then additionally incubated 30 s with NZ alone (blue cisterna in F), NZ + 5 µg/mL BFA (orange cisterna) or NZ + 1 µM NEM (yellow cisterna). (F,G) Examples of three-dimensional models of control (blue in F) penultimate medial cisternae after inhibition of vesiculation (NZ + BFA, orange in F) or membrane fusion (NZ + NEM, yellow in F) machineries; (G) Isolated Golgi membranes were incubated with 5 mg/mL native cytosol, the ATP restoration system (ARS), GTP: without (G1) or with the mutant of αSNAP (αSNAPmu; G2) for 20 min. Pores are indicated with white arrows. Addition of α-SNAPmu induced narrowing of cisternal pores; (H) HeLa cells treated with NEM and analyzed 3 min after re-warming; mannosidase II (ManII) was labeled by nano-gold (arrows). Red arrow, cisternal invagination; (I) Incubation of isolated Golgi membranes with native cytosol, ARS/GTP (G) and αSNAPmu for 90 min. Cryosection labeled for ManII. Vesicles (arrows) do not contain ManII. Bars. 300 nm (A); 100 nm (B); 50 nm (C); 250 nm (F,G); 120 nm (H,I).

