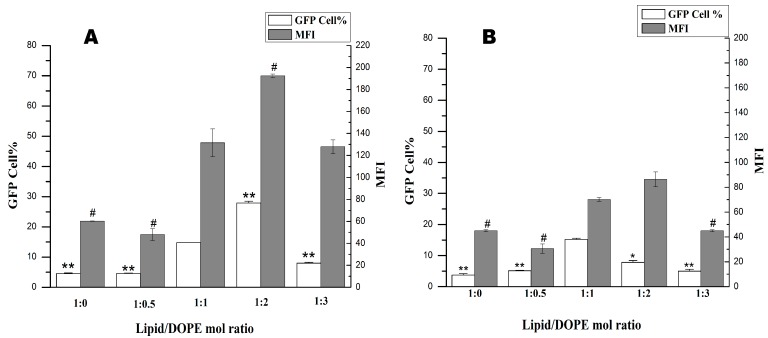
Figure 5.
Transfection efficiencies of cationic lipids 1a (A) and 1b (B) with various compositions of DOPE (1,2-dioleoyl-l-α-glycero-3-phosphatidyl-ethanolamine) in 293T cells. Each bar value represents the mean ± SD of triplicate experiments. Data are expressed as the number of transfected cells and mean fluorescence intensity (MFI) as obtained from flow cytometry analysis. * p < 0.05, ** p < 0.01, compared with the number of transfected cells at a lipid:DOPE ratio of 1:1. # p < 0.05, compared with the mean fluorescence intensity at a lipid:DOPE ratio of 1:1.

