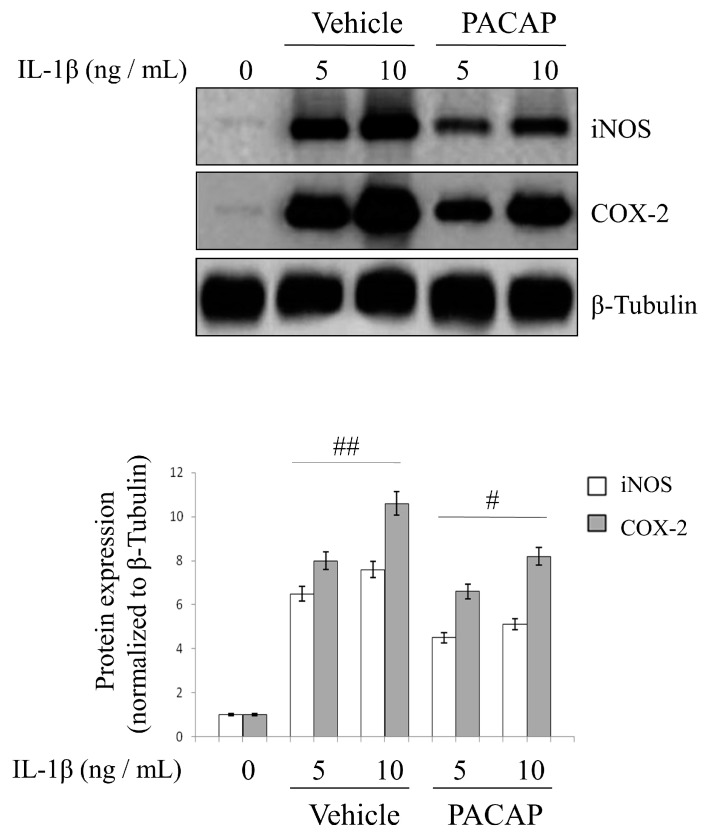
Figure 6.
Effects of PACAP on IL-1β induced iNOS and COX-2 expression levels. Chondrocytes were exposed to IL-1β for 24 h at indicated concentrations and changes in iNOS and COX-2 protein levels were measured by Western blot analyses; Bands were quantified using ImageQuantTL software and normalized values were plotted in the histogram shown. Each value represents the mean band densities ± SEM from each group. (# p < 0.05 or ## p < 0.01 vs. vehicle). Experiments were repeated at least three times with similar results.

