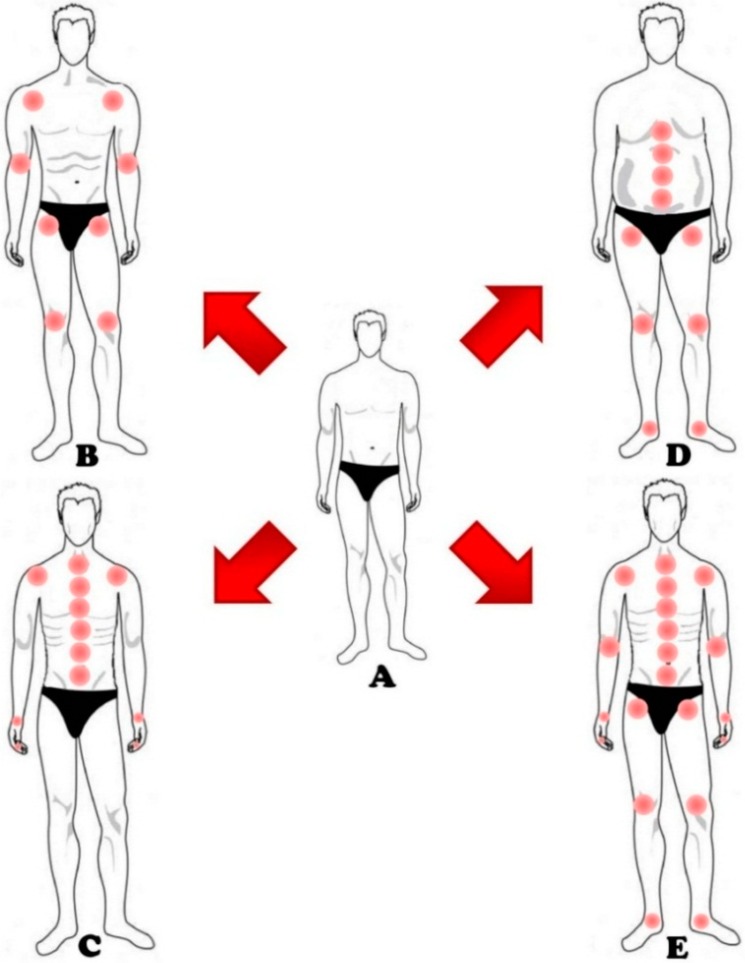
Figure 3.
This figure shows 5 different lifestyles. (A) Pictograph A shows a person who leads a healthy life choosing a controlled diet, rich in nutrients and vitamins, and moderate physical activity. This subject reduces the risk to develop OA, both in cartilage alterations and inflammation; (B) Pictograph B shows a sportsman. In this case, the extremely forced physical activity, wrong movement, and direct joint impact or torsional load, lead to an increased joint risk. This risk is mostly located in the joint of the shoulders, arms, hips and knees; (C) Pictograph C shows a person who leads a sedentary lifestyle. Here, little physical training is responsible for muscle weakening and, consequently, to wrong posture. The major risk is visible in the joints of the spinal column and shoulders. Furthermore, the use of smart phones and computers increases the risk of OA in the joints of hands and wrists; (D) Pictograph D shows an obese subject. Here, the increased body weight lies heavily on the joints of the spinal column and of the lower limbs, such as hips, knees and ankles; (E) Pictograph E shows a subject not consuming a proper diet. The loss of vital nutrients increases the risk of developing OA in most of the joints of the subject itself.

