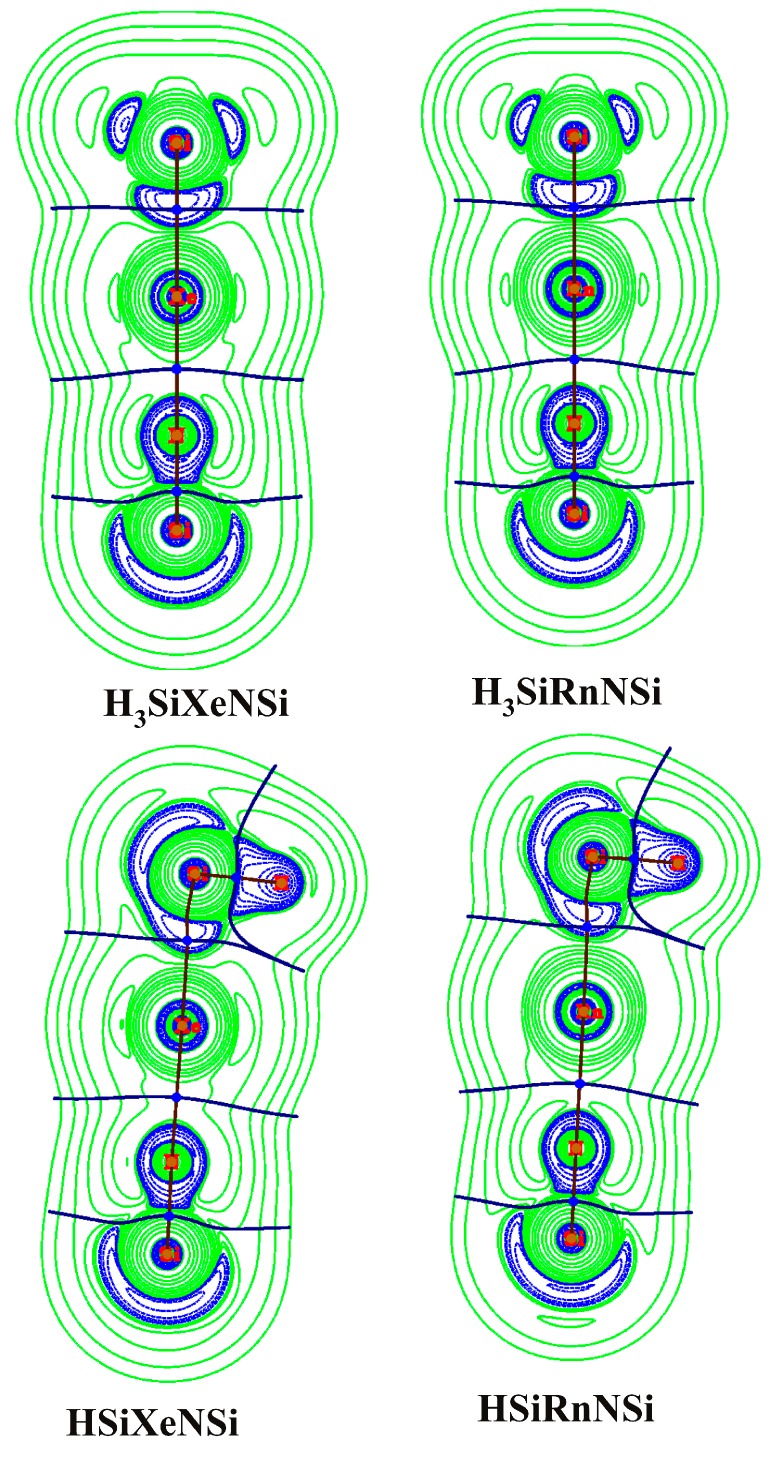
Figure 2.
Contour plots of the Laplacian of the electron density of H3SiXeNSi and HSiXeNSi clusters at a particular plane computed at the MP2/def2-QZVPPD/WTBS level (WTBS is used for Xe and Rn; The green-colored region shows the area of ∇2ρ(r) > 0, whereas the blue-colored region shows the area of ∇2ρ(r) < 0).

