
Figure 2.
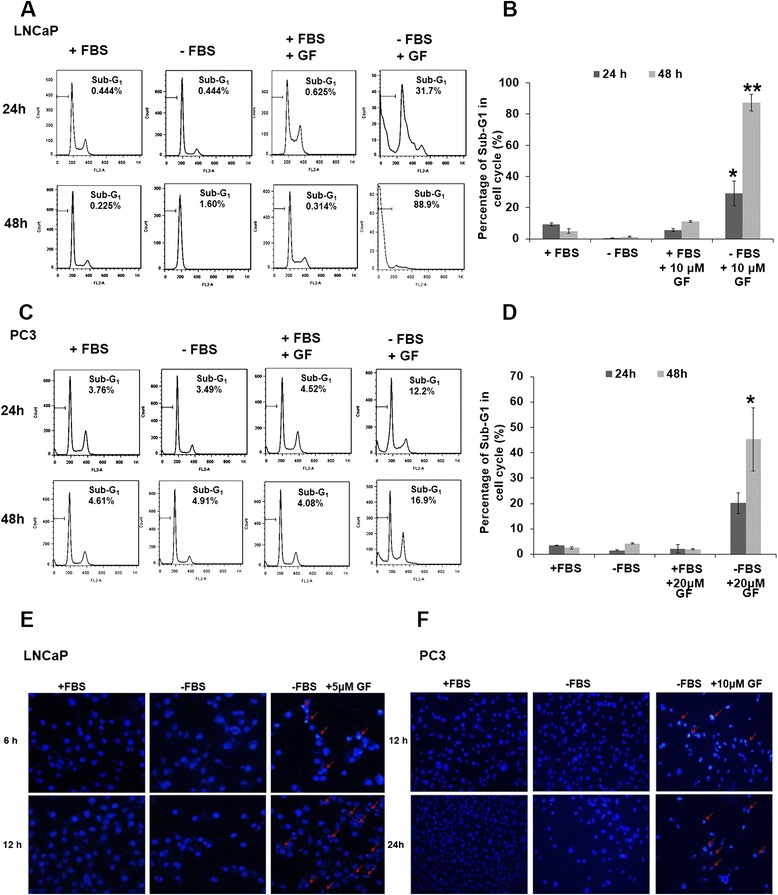
GF induces apoptosis in prostate cancer cells. (A) Flow cytometry analysis of sub-G1 population in GF-treated LNCaP cells. LNCaP cells were treated with GF (10 μM) cultured in either complete medium (RPMI1640 with serum) or nutrient-deprived medium (RPMI1640 without serum) for 24 h or 48 h. The cells were fixed and stained with propidium iodide (PI). (B) Statistic analysis of Sub-G1 fraction of samples in (A). (C) Flow cytometry analysis of sub-G1 population in GF-treated PC3 cells. PC3 cells were treated with GF (20 μM) cultured in either complete medium (RPMI1640 with serum) or nutrient-deprived medium (RPMI1640 without serum) for 24 h or 48 h. (D) Statistic analysis of Sub-G1 fraction of samples in (C). Data are presented as means ± SD from three independent experiments and analyzed using Student’s t-test (*P <0.05, **P <0.01). (E and F) Nuclear morphology changes in GF treated LNCaP cells (E) or PC3 cells (F). Cells were treated with GF (5 μM for LNCaP, 10 μM for PC3) cultured in either complete medium (RPMI1640 with serum) or nutrient-deprived medium (RPMI1640 without serum) for 6 h or 12 h. Arrows pointed to typical chromatin condensation and DNA fragmentation.