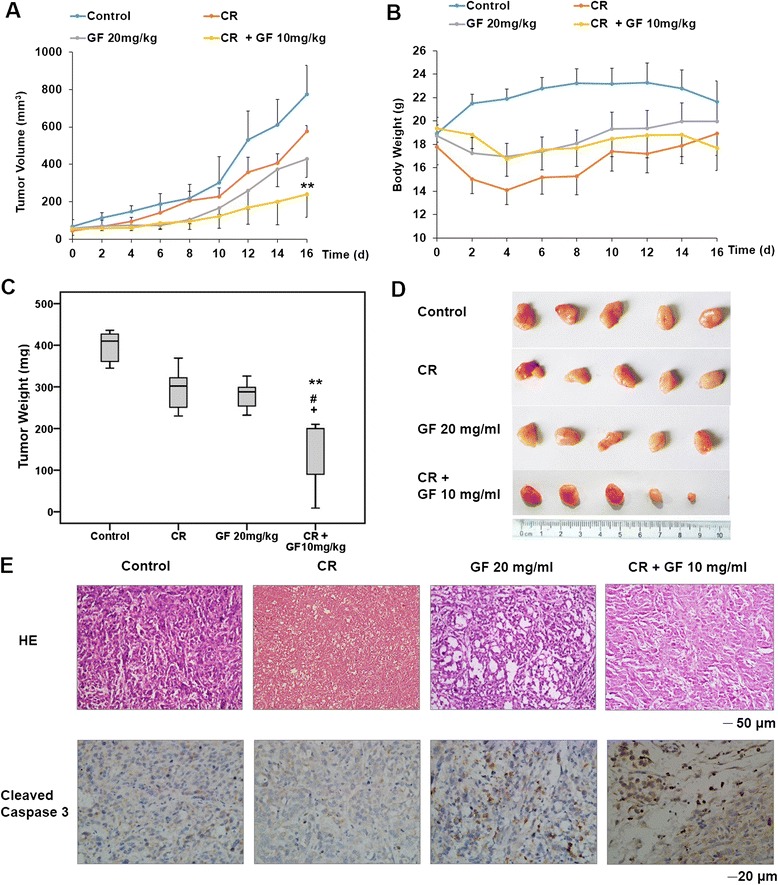
Figure 7.

GF exhibits anticancer activity in PCa xenograft. (A) Four weeks old nude mice were engrafted with PC3 cells and observed until tumors reached ~50 mm3. Tumor-bearing mice were then treated vehicle, GF (20 mg/kg) by intraperitoneal once every 2 d for a total of eight injections. (B) Body weight of the mice. (C) Mice were sacrificed and tumors were resected and weighed 2 d after the final injection. Control (mean: 395.8 mg; median: 410.0 mg; range: 345.0–436.0 mg), CR (mean: 296.0 mg; median: 302.0 mg; range: 230.0–369.0 mg), GF (mean: 279.8 mg; median: 288.0 mg; range: 232.0–326.0 mg) and CR + GF (mean: 141.8 mg; median: 200.0 mg; range: 9.0–210.0 mg). Error bars represents maximum and minimum; boxes represents the upper and lower quartiles and median. ** P <0.01 comparing with Control; #P <0.05 comparing with CR; +P <0.05 comparing with GF 20 mg/kg. The statistic analysis was performed by Student’s t-test. (D) Images for representative tumor from (C). (E) Histological stains (H&E staining) of tumor cross-sections from mice treated with control, CR, GF and GF + CR. Images were taken at 200X magnification. Scale bar, 50 μm. Immunohistochemical staining for cleaved Caspase3 in tumor sections. Images were taken at 400X magnification. Scale bar, 20 μm.
