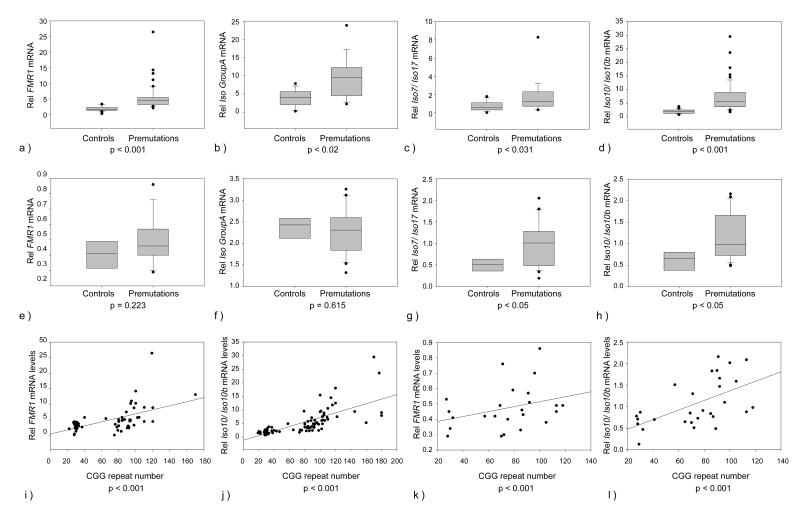
Figure 2.
Relative mRNA expression levels of FMR1 isoforms by qRT-PCR. Box plots show mRNA expression levels between the control and the premutation groups in PBMC (a, b, c, d) and brain tissue (e, f, g, h). As expected increased levels of FMR1 mRNA were observed in premutation PBMCs (a), (p<0.001) compared to controls. Statistical significant differences were also observed between premutations and controls in the expression levels of FMR1 isoforms included in Group A (b), in Group B (not showed), in Group C (not showed), in the expression levels of Iso7 and Iso 17 (part of Group C) (c), and of Iso10 and Iso10b (d). In brain tissue statistical significant differences were observed between the premutation and the control group in the expression levels of Iso7 and Iso17 (g) and of Iso10 and Iso10b (h). Linear regression plots show a significant correlation between total FMR1 mRNA expression levels and CGG repeat length in PBMCs (i) (p<0.001) and in brain tissue (k). A significant correlation between FMR1 variants Iso10 and Iso10b expression levels and CGG repeat number was also observed in PBMCs (j) (p<0.001) and in brain tissue (l) P<0.001.

