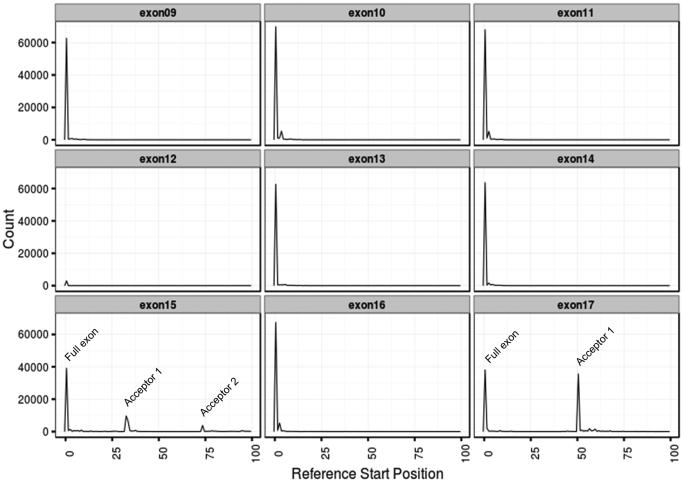
Figure 4.
Histogram plots of exon start sites. A peak is representative of the start site for each exon. A low exon 12 peak is a direct representation of the magnitude of the different exon contributions as only very few isoforms include exon 12 within the pool examined (~10% in all three tissues) while in the majority, exon 12 is spliced out. On the contrary, exon 14 is spliced out in approximately 10-20% (in all three tissue). Of exons 9 through 17, only exons 15 (splice acceptors 1 and 2) and exon 17 (splice acceptor 1) exhibit alternative start sites. These are identified by the additional peak(s) in the respective histogram plots.

