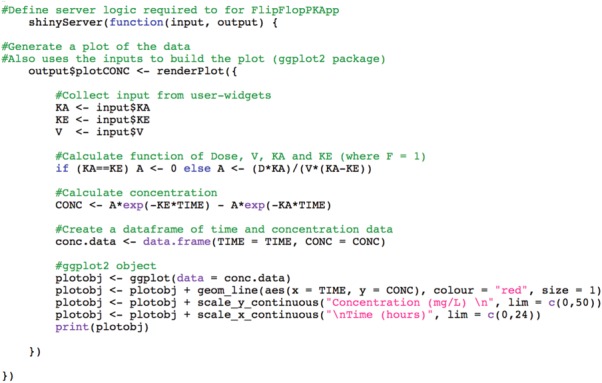
Figure 2.

server.R excerpt from flip-flop kinetics application. The output object, plotCONC, uses the renderPlot function to call widget values for absorption rate constant (KA), elimination rate constant (KE), and volume of distribution (V) from the user-interface, creates a data frame consisting of drug concentrations (CONC) at each specified time-point (TIME; time sequence not shown), and plots the concentration–time profile using the ggplot25 package. As output and the renderPlot function are reactive, they are placed within shinyServer.
