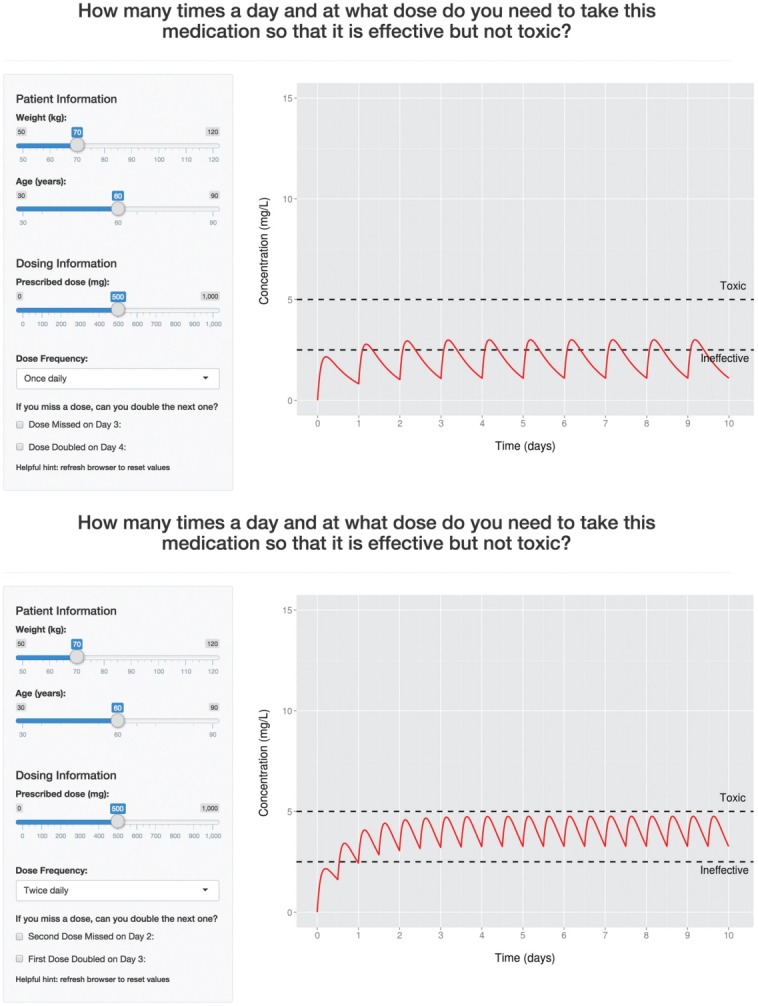
Figure 3.

Preliminary patient education tool application. Shown are screenshots of the application featuring a one-compartment first-order absorption model running in a browser-window. The concentration–time profile is depicted as the solid red line, and black horizontal dashed lines represent the hypothetical therapeutic window (drug is ineffective at less than 2.5 mg/L, and toxic when greater than 5 mg/L). Top: Upon application initiation, the “Dose Frequency” selection box is pre-set to once daily and the output plot displays the concentration–time profile for the hypothetical drug over 10 d (10 doses) accordingly. Bottom: A scenario where the twice-daily dosing regimen is selected. The plot automatically updates to show the concentration–time profile when 20 doses are administered within the same 10-d period. The “missed dose” and “double dose” checkboxes also automatically update to describe specific doses in the twice-daily regimen.
