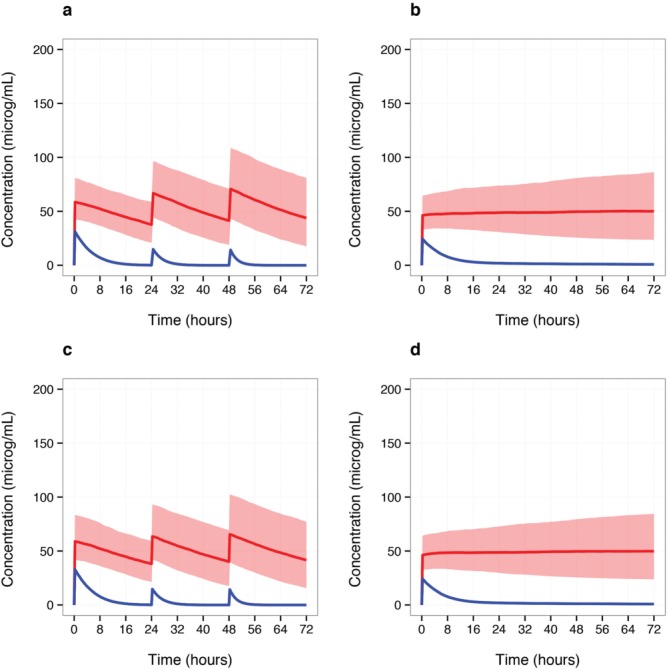
Figure 5.

Comparison of Shiny and NONMEM® simulation outputs. Shown are the median concentrations at 15-min intervals for R- (blue solid line) and S-ibuprofen (red solid line), and the red shaded region represents the 10th and 90th percentiles for S-ibuprofen simulated concentrations, over a 72-h period. For each dosing regimen, a 1 kg patient with a post-natal age of 12 h was used to create a simulated population. (a,c) Concentration–time profiles based on the simulation of 1,000 individuals administered the IV loading-bolus-bolus dosing regimen (20-10-10 mg/kg). (b,d) Concentration–time profiles based on the simulation of 1,000 individuals administered the IV loading-continuous infusion regimen (16 mg/kg loading dose, 24 mg/kg continuously infusion over 72 h). (a,b) Shiny Application Example 3 output; code embedded in Shiny's server.R script was converted to a standard R-script to produce plots. (c,d) NONMEM® output; simulation output was processed and plotted using R.
