Figure 3.

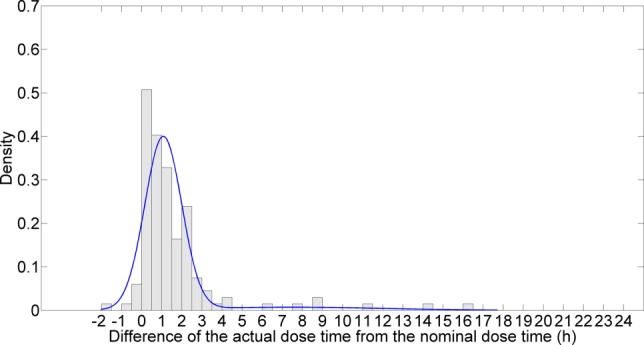
Parametric distribution of timing variability. This distribution is provided by a mixture of 2 normals. The x-axis represents the difference of the actual dose time from the nominal dose time (hours). The y-axis is density.

Parametric distribution of timing variability. This distribution is provided by a mixture of 2 normals. The x-axis represents the difference of the actual dose time from the nominal dose time (hours). The y-axis is density.