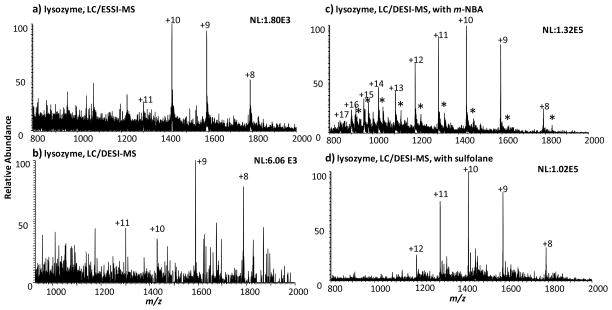
Figure 4.
Mass spectra of lysozyme following the HPLC separation obtained by (a) ESSI analysis after splitting the eluent (split ratio: 100:1), (b) DESI analysis of the jet eluent using the spray solvent of CH3OH/H2O/HOAc (50:50:1 by volume), (c) DESI analysis of the jet eluent using the spray solvent of CH3OH/H2O/HOAc (50:50:1 by volume) containing 50 mM m-NBA, and (d) DESI analysis of the jet eluent using the spray solvent of CH3OH/H2O/HOAc (50:50:1 by volume) containing 200 mM sulfolane. The asterisk labeled peaks in (c) probably correspond to the protein adduct ions with m-NBA.

