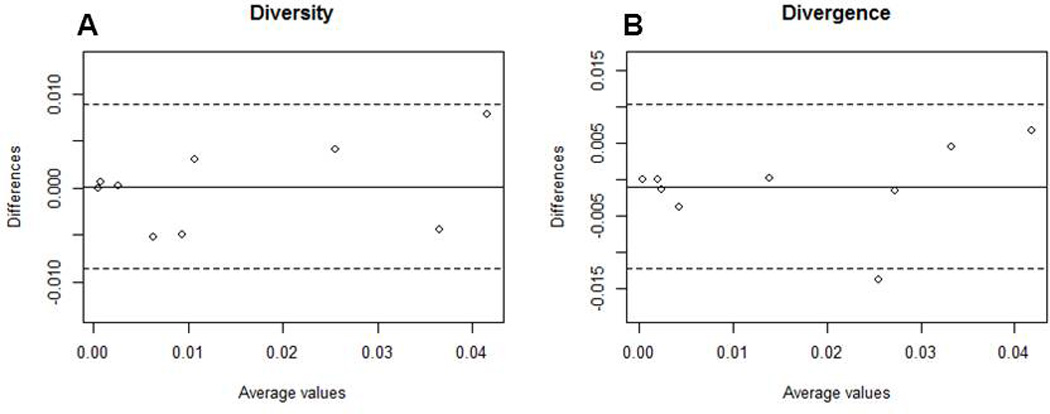
Figure 2. Genetic diversity and divergence are similar among envelope V1–V3 sequences derived using either SGA or bulk PCR strategies.

Bland Altman plots of genetic diversity (A) and divergence (B) among sequences obtained from SGA compared to bulk PCR. The solid line shows the mean difference among the 2 methodologies and the dotted lines delineate values at 2 standard deviations of the difference. The mean difference in diversity and divergence was 0.00013 and −0.00099 respectively. The standard deviation in diversity and divergence was 0.0046 and 0.0057 respectively. The x-axis shows the average and the y-axis shows the difference of the value obtained by the 2 methodologies.
